USD/TRY Price Analysis: Hovers inside fortnight-old triangle around $13.50
- USD/TRY prints mild gains to pare two-week losses.
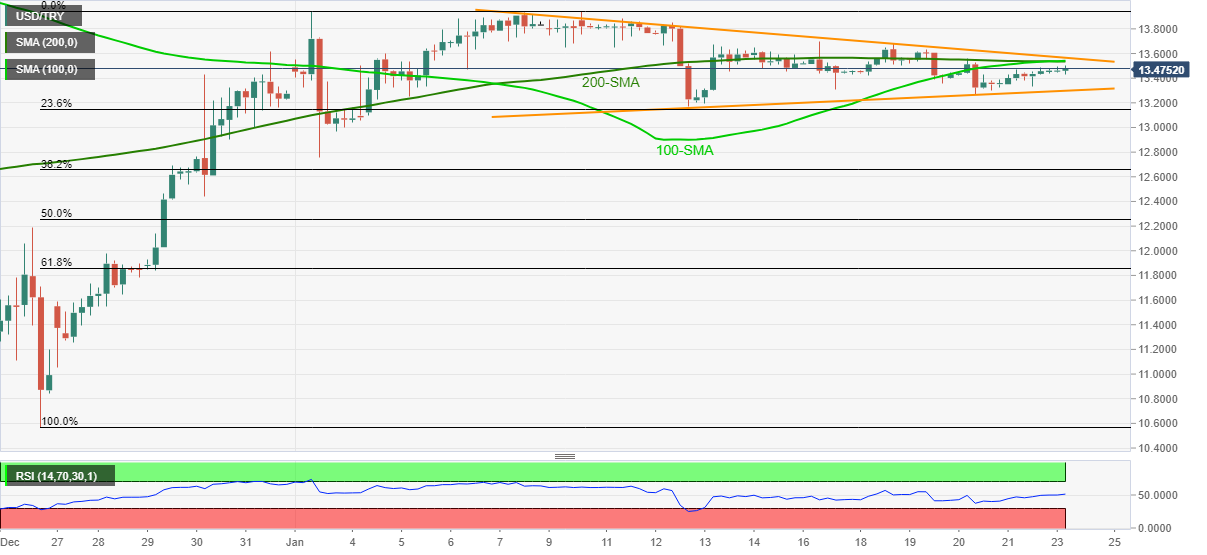
- 100/200-SMA confluence offers strong resistance inside immediate triangle.
- Steady RSI hints at further grinding below the key SMAs.
USD/TRY begins the trading week on a positive note around $13.48, up 0.10% intraday, during Monday’s Asian session.
Even so, the Turkish lira (TRY) pair remains inside a two-week-long symmetrical triangle amid steady RSI.
It should be noted, however, that sustained trading below the 100 and 200 SMA confluence, near $13.55, keeps USD/TRY sellers hopeful.
Should the quote rise past $13.55, the odds of its run-up to cross the stated triangle’s resistance line, near $13.60 by the press time, can’t be ruled out.
Following that, the monthly high around $13.95 and the $14.00 threshold will lure the pair buyers.
On the contrary, pullback moves remain elusive beyond the triangle’s support line, around $13.30 at the latest.
Even if the USD/TRY bears manage to conquer the $13.30 support, the $13.00 threshold will challenge the downside before highlighting the 61.8% Fibonacci retracement of December 24 to January 03 upside, near $12.40.
USD/TRY: Four-hour chart
Trend: Further weakness expected