USD/TRY Price Analysis: Bulls are testing critical daily resistance
- USD/TRY bulls are coming up for air into resistance.
- USD/TRY bulls need to break the neckline of the M-formation.
Technically, USD/TRY is stuck in a sideways range between the 13.00 and 14.00 areas. From a political front, the lira could find further stability as we approach planned elections scheduled for no later than mid-2023.
The economic turmoil has already started to hit President Erdogan's opinion poll ratings as Erdogan's scheme to curb the lira's weakness has been seen to fail.
However, as the technical outlook stands, there is a case for both the bulls and bears while the price continues to consolidate in familiar territory as follows:
USD/TRY daily chart
-637777229225918666.png)
The price is on the verge of either a breakout to the upside or downside according to the daily chart's structure and price action. Zooming in, we can identify a resistance according to the M-formation's neckline as follows:
-637777231591529895.png)
The M-formation is a reversion pattern that has a high completion rate of the rice moving back in to test the neckline of the formation. In this case, there was very little in the way of downside before the correction. Therefore, at his juncture, the price could well keep going higher to break the structure:
-637777233832635652.png)
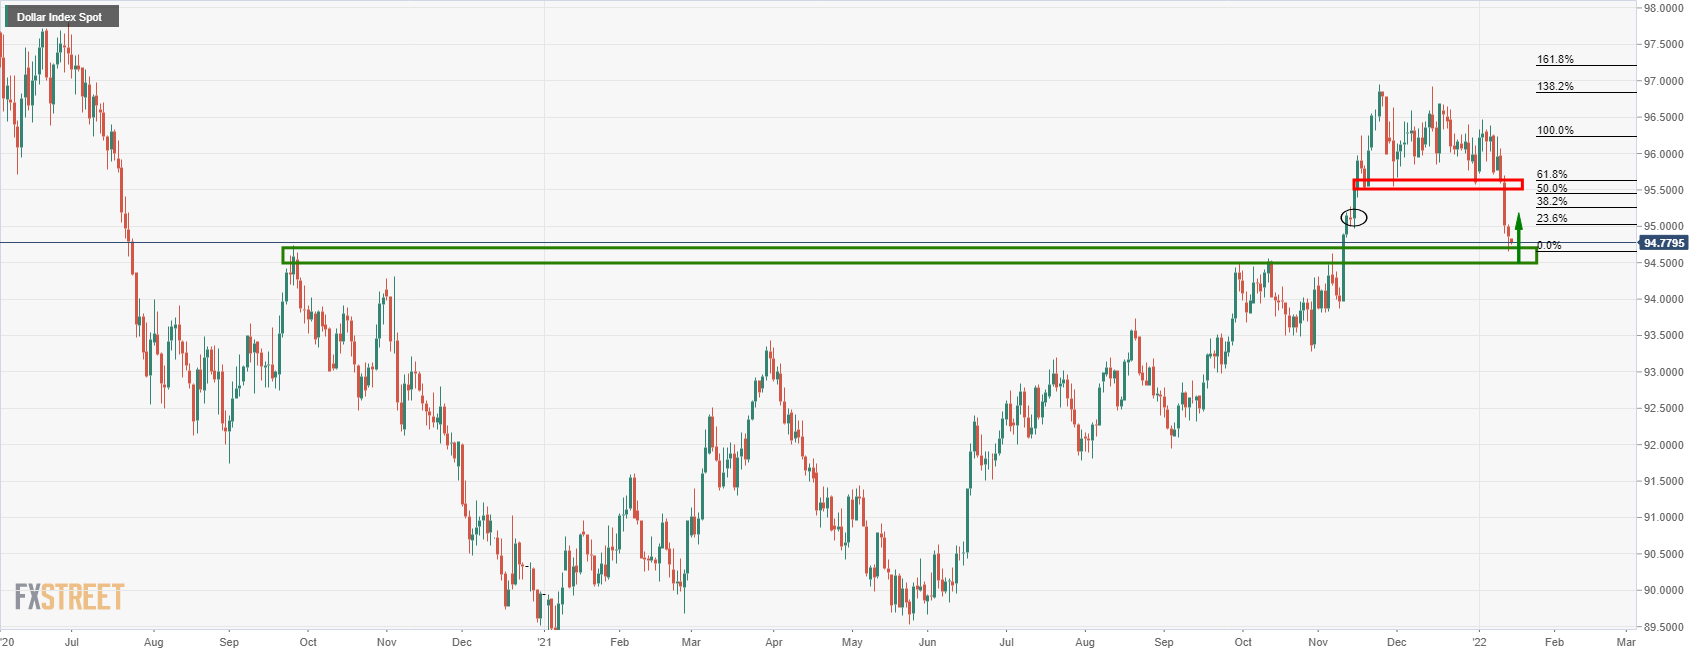
DXY daily chart
The US dollar, meanwhile, is meeting daily support and would be expected to correct at this juncture, which would lean bullish for USD/TRY: