Silver Price Analysis: XAG/USD bulls await a sustained move beyond 100-day SMA
- Silver shot to two-week tops on Monday, though lacked follow-through.
- The set-up favours bullish traders and supports prospects for further gains.
- Dips below the $24.00 mark could now be seen as an opportunity for bulls.
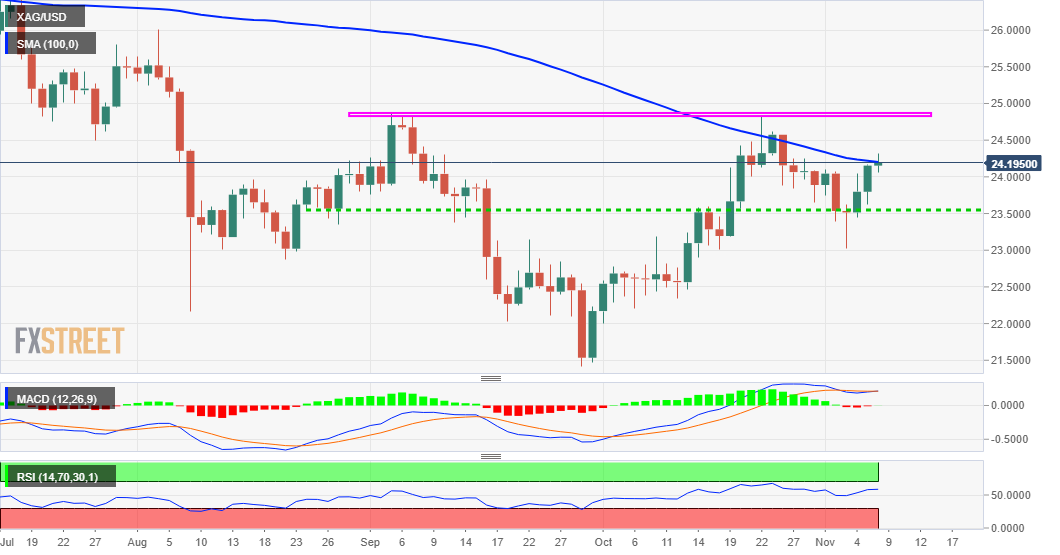
Silver built on last week's goodish rebound from over two-week lows and gained some follow-through traction on Monday. The uptick pushed the XAG/USD to two-week tops, around the $24.30 region, though bulls struggled to capitalize on the move beyond 100-day SMA.
Looking at the broader picture, the recent pullback from the $24.80-85 region found decent support and stalled near the $23.00 mark. The latter should now act as a key pivotal point for traders and help determine the next leg of a directional move for the XAG/USD.
Meanwhile, bullish technical indicators on hourly/daily charts support prospects for an eventual break through the 100-day SMA barrier. This will set the stage for a move towards the $24.55 intermediate hurdle en-route October monthly swing highs, around the $24.80 area.
On the flip side, any meaningful pullback below the $24.00 mark could be seen as a buying opportunity and remain limited near the $23.70 level. This is followed by support near mid-$23.00s, below which the XAG/USD could accelerate the slide towards the $23.00 mark.
Sustained weakness below would turn the XAG/USD vulnerable to test the next relevant support near mid-$22.00s before eventually breaking below the $22.00 round-figure mark. The downward trajectory could get extended towards YTD lows, around the $21.40 area touched in September.
Silver daily chart
Technical levels to watch