Silver Price Analysis: Daily bullish extension on the cards
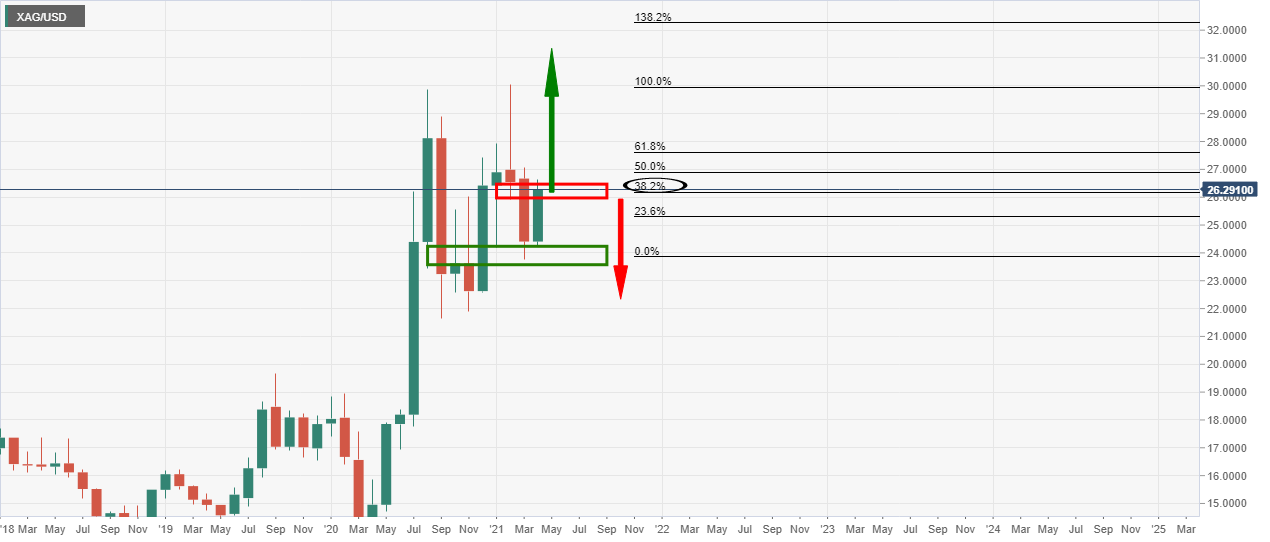
- Silver is testing a critical area of supply on the monthly chart.
- The daily chart is, however, offering a meanwhile bullish continuation opportunity.
The bulls are in charge of the monthly and weekly time frames and the daily advance is riding the 10-EMA for a portable test and penetration of daily resistance for the forthcoming sessions.
Monthly chart

The monthly chart is bullish on a break of the 38.2% Fibonacci confluence and resistance, but it will be otherwise trapped on failures there, offering scope to downside opportunities on the lower time frames.
Weekly chart

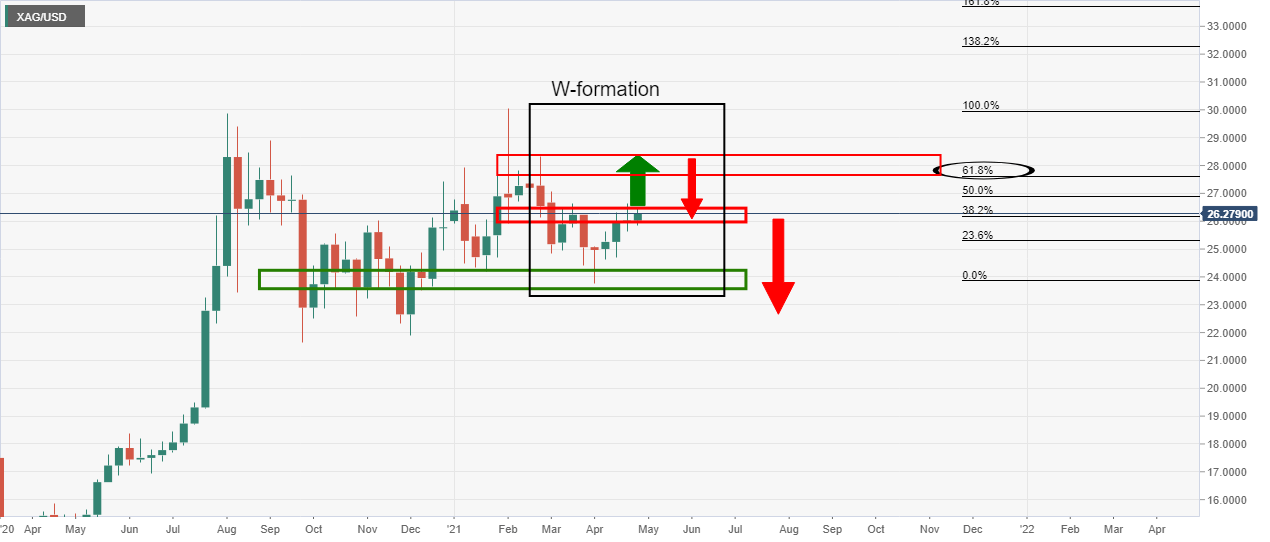
The weekly chart's W-formation is compelling and argues for an upside extension to test prior highs at a 61.8% Fibonacci confluence prior to a correction back to test old resistance that would be expected to turn to support.
This leaves the daily outlook potentially bullish, so let's move down to the daily chart to take a look...
Daily chart

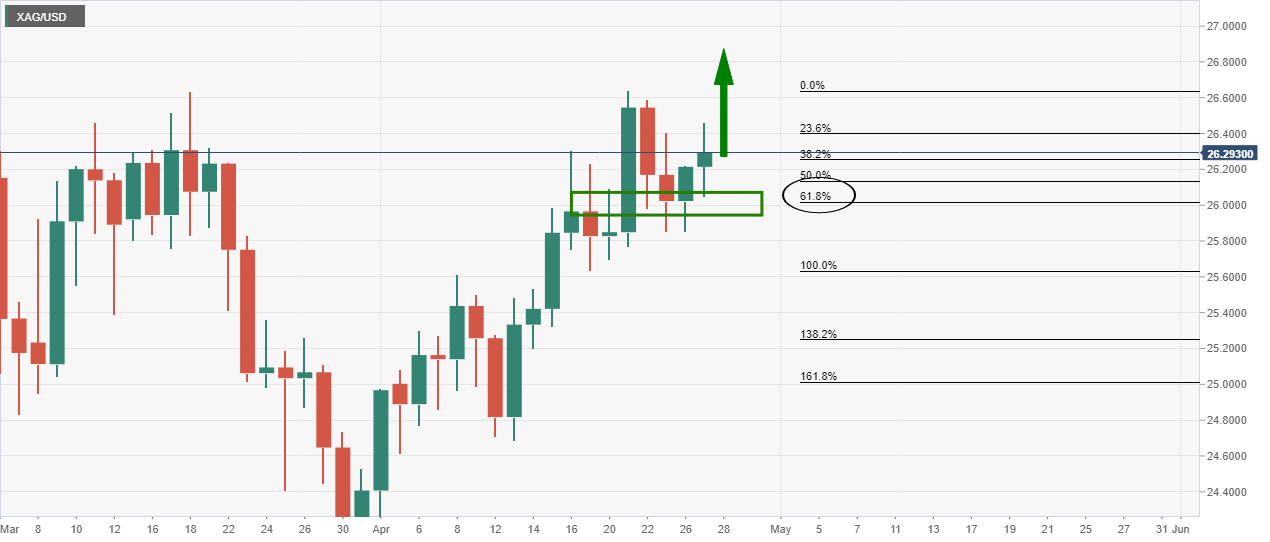
Indeed, the price is moving higher from support at the 61.8% Fibonacci retracement of the prior bullish impulse.
The 4-hour time frame can be monitored for bullish structure from where bulls might wish to engage to target a higher high on the daily chart and deeper penetration of both monthly and weekly resistances.
4-hour chart

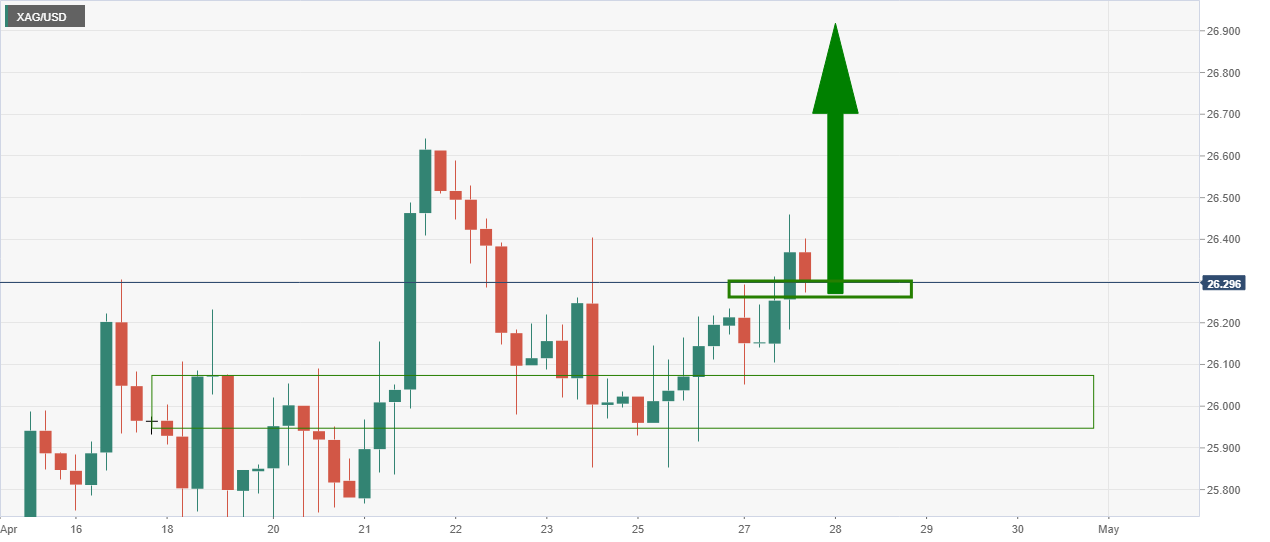
The 4-hour chart has corrected back to test an old resistance from which offers a bullish prospect and discount for the bulls to engage and target a bullish continuation on the daily time frame.
