GBP/AUD Price Analysis: Daily bullish correcton on the cards
- GBP/AUD is taking on bullish commitments through support.
- The daily chart is hitting the brakes and could be in the throes of an upside correction.
GBP/USD is in the hands of the bears from a top-down analysis perspective and the following illustrates the probable trajectory across the time frames:
Monthly chart
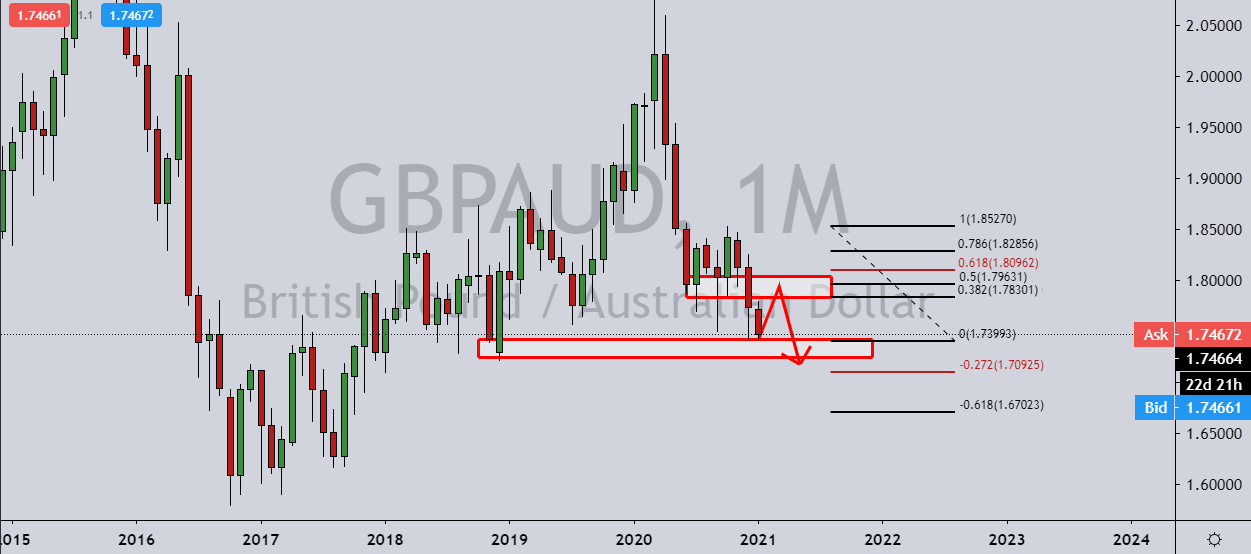
The monthly chart shows the price embarking on a test of the demand zone and creating an overextended M-formation that will at some stage need to be corrected.
However, there is still some way to go on the downside according to the weekly and daily charts.
Weekly chart
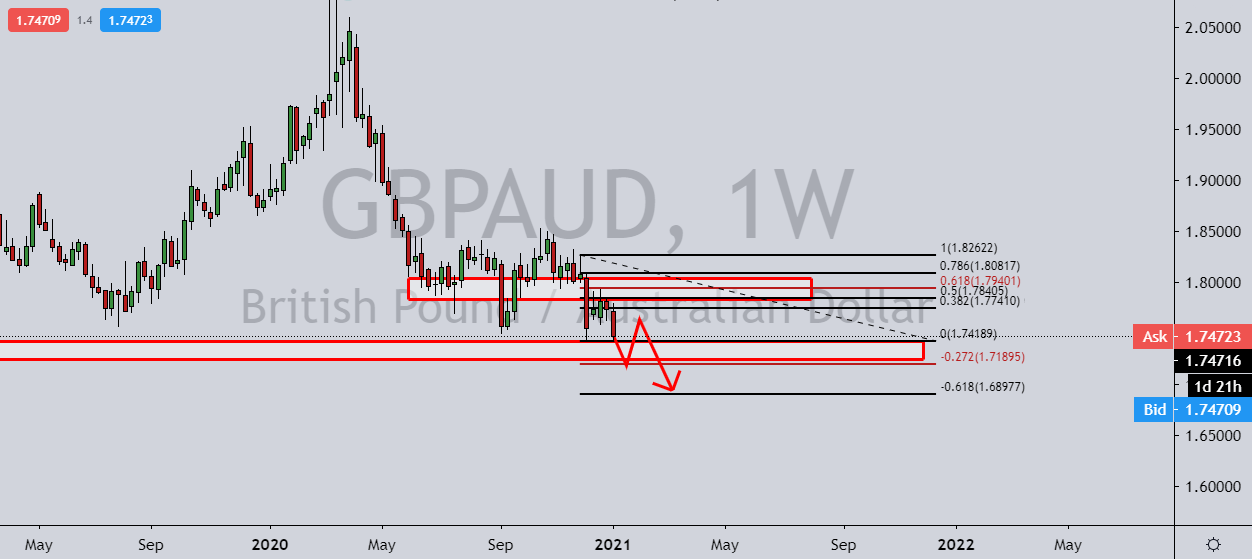
The weekly chart is showing that the price is already in a continuation phase following the last correction into the resistance area and a 61.8% Fibonacci retracement level.
Daily Chart
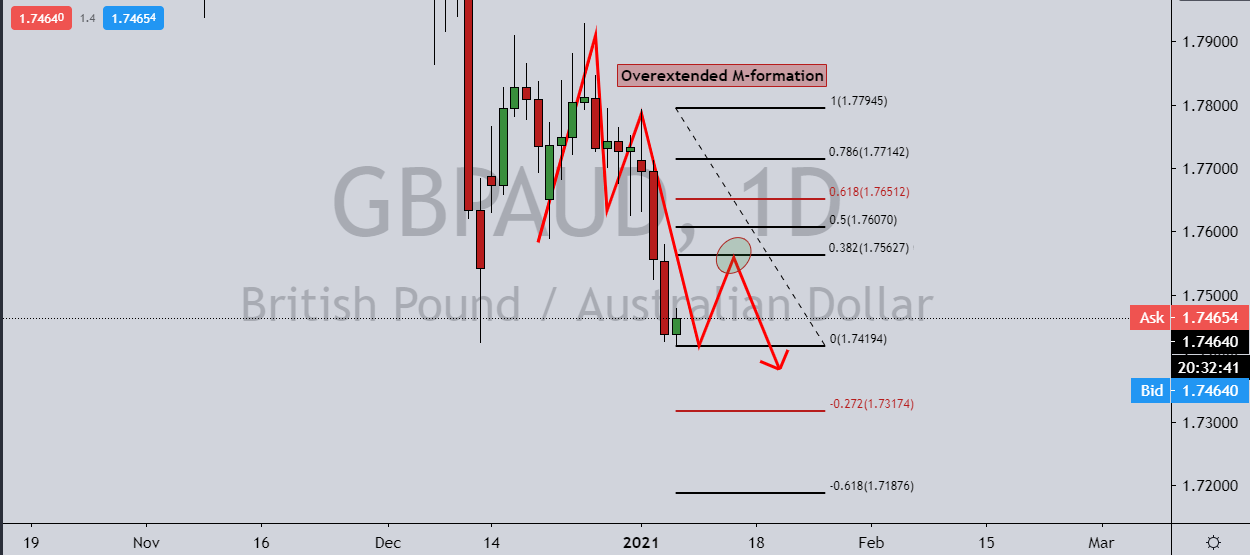
The daily chart is showing an overextended M-formation which would tally up with the prospects of a downside continuation on the weekly chart's fresh bearish impulse.
However, an upside correction is on the cards to at least a 38.2% Fibonacci retracement level, if not all the way to test a 50% mean reversion that as a confluence with prior daily mid-Dec lows.