GBP/USD Price Analysis: Bounces off 21-day SMA towards 1.3500
- GBP/USD refreshing intraday high while extending recovery moves from 1.3429.
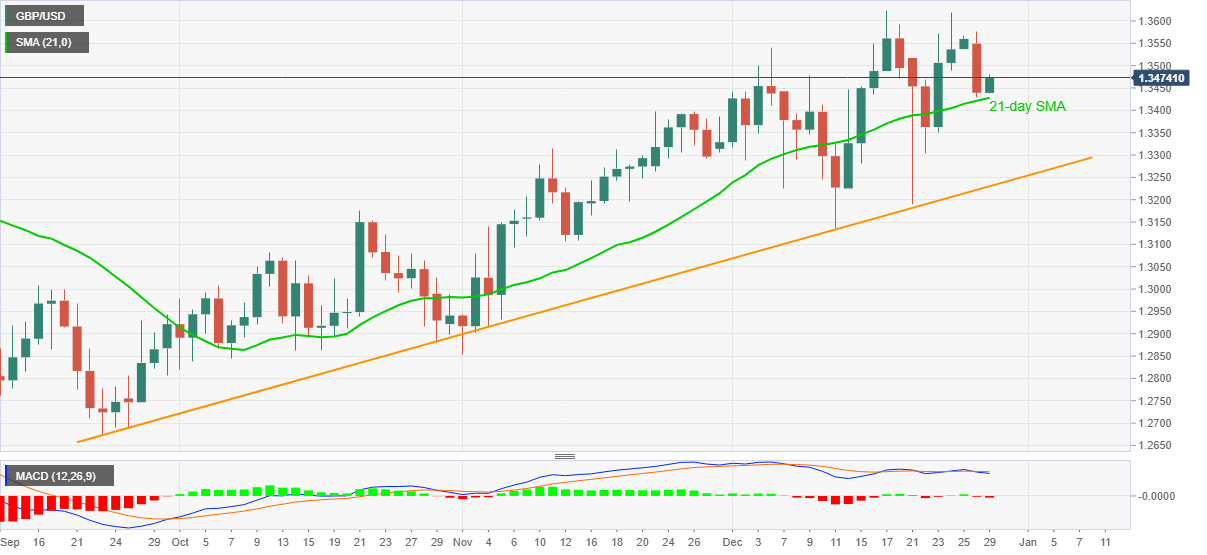
- Dwindling MACD, repeated failures to cross 1.3600 probe buyers.
- Three-month-old ascending trend line adds to the downside filters.
GBP/USD rises to 1.3479, up 0.27% intraday, during Tuesday’s Asian session. The cable revisited last Wednesday’s lows the previous day before recovering from 21-day SMA.
Although corrective pullback from the key short-term SMA suggests the pair’s further upside towards the 1.3500 round-figure, 1.3570 and the 1.3600 threshold can challenge any extra north-run.
In a case where the quote manages to cross 1.3600 on a daily closing, it needs to pierce the monthly peak surrounding 1.3625 before eyeing the March 2018 low near 1.3710.
On the contrary, a downside break below 21-day SMA, currently around 1.3430, may recall the 1.3300 round-figure on the chart.
However, an upward sloping trend line from September 23, at 1.3230 now, will challenge the GBP/USD sellers afterward.
GBP/USD daily chart
Trend: Bullish