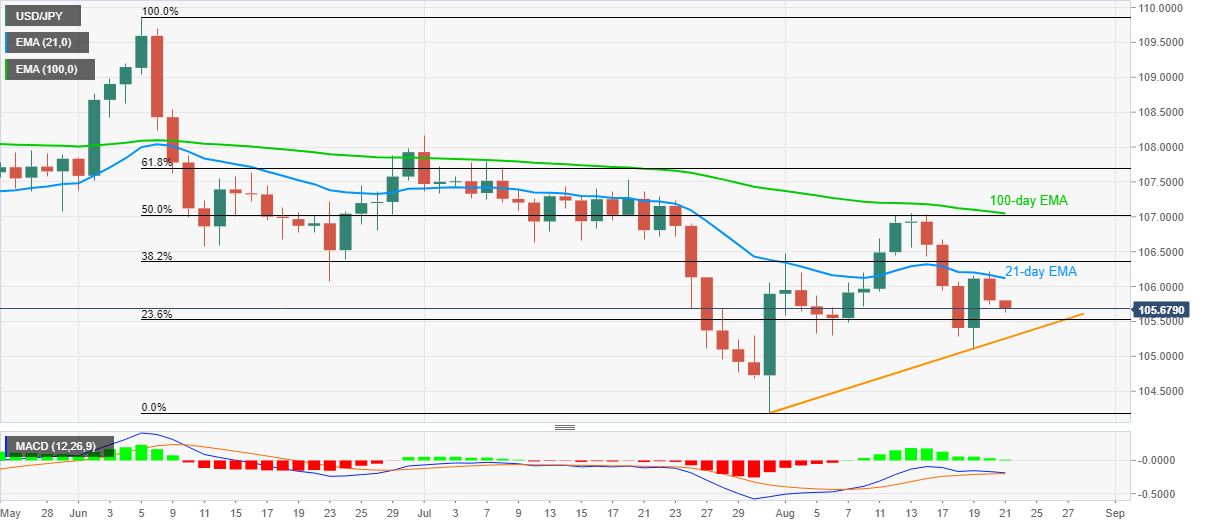
USD/JPY Price Analysis: Extends pullback from 21-day SMA towards monthly support line
- USD/JPY stays pressured near the intraday low while extending losses from 106.21.
- MACD parts ways from the bullish territory to suggest further weakness.
- 50% of Fibonacci retracement, 100-day EMA offers strong resistance.
USD/JPY remains depressed around 105.65, down 0.14% on a day, amid the pre-European trading on Friday. In doing so, the yen pair stretches the previous day’s U-turn from 21-day EMA.
Other than the sustained weakness below near-term key EMA, receding strength of the MACD also favors the sellers targeting an upward sloping trend line from July 31, at 105.25 now.
However, the pair’s further downside will be questioned by July 30 bottom surrounding 104.70 and the prior month’s trough close to 104.20.
Meanwhile, an upside clearance of 21-day EMA level of 106.15 can attack 106.55 but a confluence of 100-day EMA and 50% Fibonacci retracement of June-July fall around 107.05/10 will be the tough nut to crack for the buyers.
USD/JPY daily chart

Trend: Further weakness expected
