AUD/USD Price Analysis: Immediate falling channel probes recovery above 0.7100
- AUD/USD stretches pullback from 0.7092 to pierce nearby falling triangle’s resistance.
- A two-day-old falling channel adds worries for the bulls.
- Sellers have multiple downside barriers to justify control.
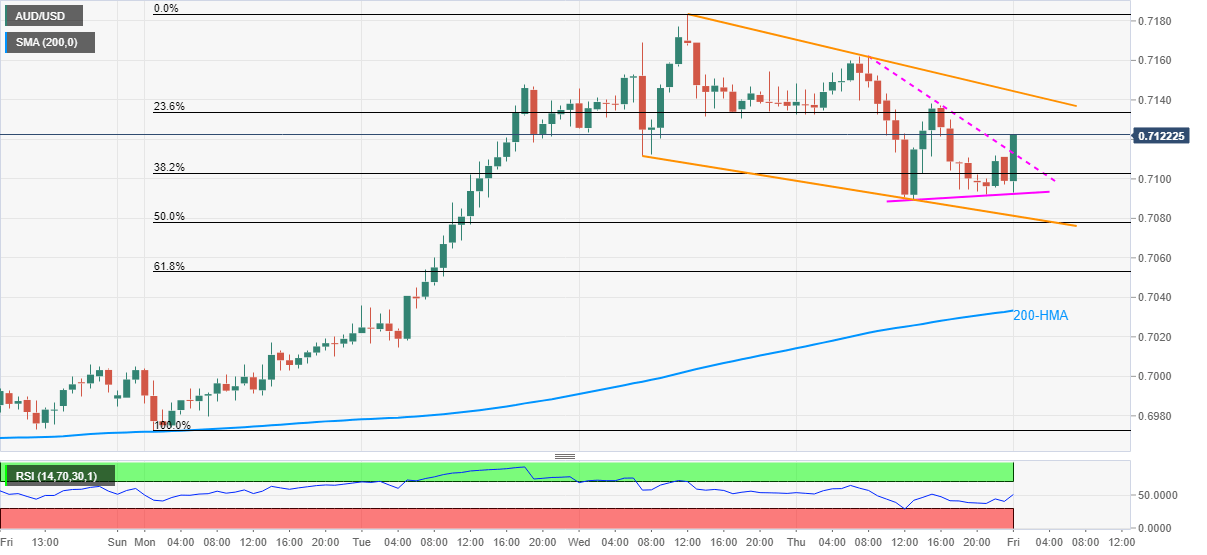
AUD/USD picks up the bids near 0.7118 during Friday’s Asian session. In doing so, the aussie pair break the upper line of the adjacent descending triangle while staying inside a short-term falling trend channel. It should be noted that the quote flashed its first negative daily closing in five days on Thursday.
While a clear break of the nearby triangle will escalate the pair’s up-moves towards the channel’s resistance line, at 0.7144 now, the monthly high around 0.7183 and 0.7200 round-figure will add worries for the bulls.
Should the pair manage to stay strong past-0.7200, highs marked during the late-February and April months of 2019, around 0.7207/08, will cap the further north-run.
On the flip side, 0.7090 and 0.7080 are likely immediate supports for the pair traders to watch, a break of which could attack 61.8% Fibonacci retracement level of July 20-22 upside, at 0.7053, followed by 200-HMA level near 0.7030.
During the pair’s further weakness past-0.7030, the 0.7000 threshold will pop-up on the bears’ radars.
AUD/USD hourly chart
Trend: Pullback expected