Silver Price Analysis: Bulls in charge at highest levels since 2013, critical structures identified
- The price of silver has skyrocketed as the price play's catch up with its sister metal gold.
- Confirmation of the European stimulus package helped spur investor appetite in both gold and silver.
The unprecedented stimulus package is likely to push real interest rates even lower, a boom for non-yielding assets such as gold and silver.
However, silver also carries industry qualities as well, so should the global economic recovery playbook really start to gain traction in market sentiment, there could be plenty to play for on the long side still to come.
However, as the price rallies towards 2012 structure on the chart, technically, technical upside becomes limited at that point on.
Moreover, the ratio between gold and silver would be expected t lean towards gold prices amid a new surge in COVID-19 cases which actually threatens to derail the economic recovery as governments ease restrictions.
Nonetheless, the bulls are in charge at the time being and the following is a rundown of structure and possible directional patter scenarios in the price.
Monthly structures

Weekly chart notes
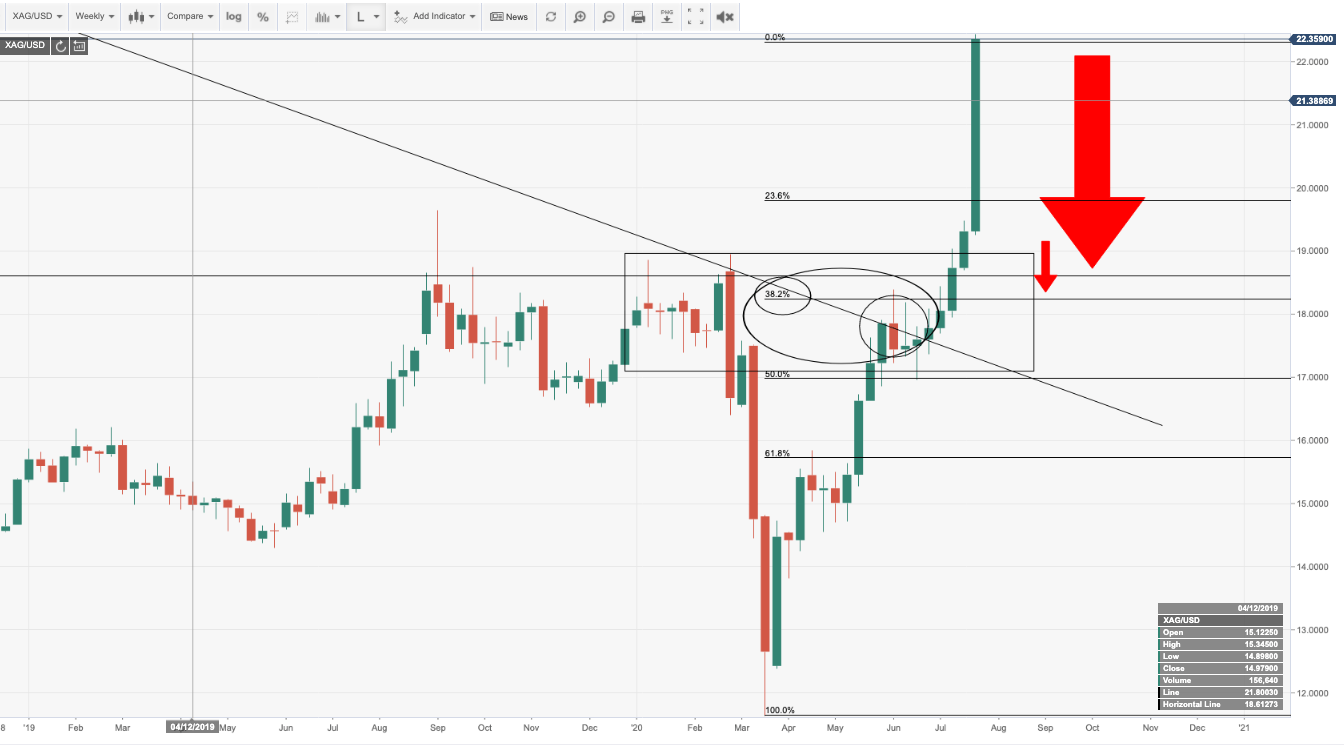
As can be seen, the price is elevated with little sign of deceleration at this point.
However, should the price begin to retrace, then the downside structure consists of a 38.2% Fib and the confluence with prior resistances.
Daily structure and potential price flow

The daily outlook shows that there could be support along the way to a 100% retracement of the impulse from prior resistance.
The 61.8% is the last defence.
If the price holds at the prior resistance, the bias will remain to the upside on a retest of old resistance new support at that juncture.
4HR chart favours upside above structure or a 38.2% Fibonacci retracement below it

On the 4HR charts, the bulls will remain in charge so long as the price can hold the currency support structure.
Failures to consolidate here and move higher will open prospects for a break to the next support structure while maintaining a bullish bias above it.