EUR/GBP Price Analysis: After failing to break the previous wave high 0.9043 is now in focus
- EUR/GBP is trading just above flat after being higher for most of the session.
- The price has sold off recently and now support levels are in focus.
EUR/GBP 4-hour chart
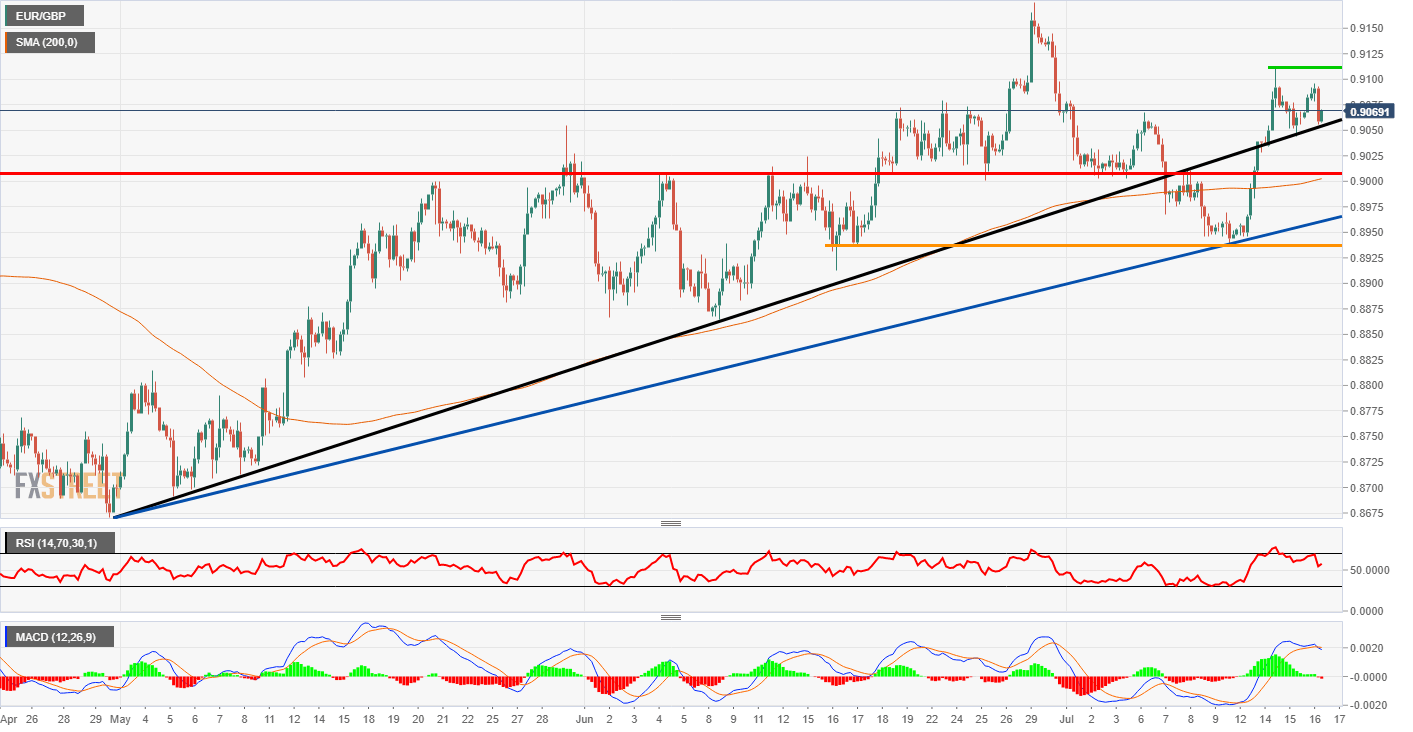
EUR/GBP is still in a pretty decent uptrend on the 4-hour chart below. There has been a sell-off in the US session and now that means the price could be heading towards support areas. There is a black internal trendline on the chart and at the moment the price is struggling to break below the support. Beyond that, the previous wave low at 0.9043 could be a target for the bears and if this level breaks it would make a lower high lower low and indicate a change in trend.
The main support level on the chart is the red support zone just above the 0.90 psychological area. Close to that zone is the 200 Simple Moving Average which could add some gravitas to the area. The main wave low is at the orange support line at 0.8938 if the price reaches and even breaks this zone then there is a stronger chance the trend may change.
The Relative Strength Index has moved away from the overbought zone. It is now heading to the 50 area and if it does break below then it could be a signal that lower prices are heading our way. The MACD histogram has also turned red but the signal lines remain above the mid-point as they are lagging signals.
On the topside, we could say the trend could continue if the green resistance wave high at 0.9112 gets taken out. Then the bulls may look to target the high on the chart of 0.9175.
Additional levels