USD/MXN Price Analysis: Mexican peso remains positive inside short-term falling wedge
- USD/MXN keeps it below the 61.8% Fibonacci retracement level.
- 200-bar SMA, weekly resistance line will check buyers inside the bullish formation.
- April low can lure sellers past downside below the monthly support line.
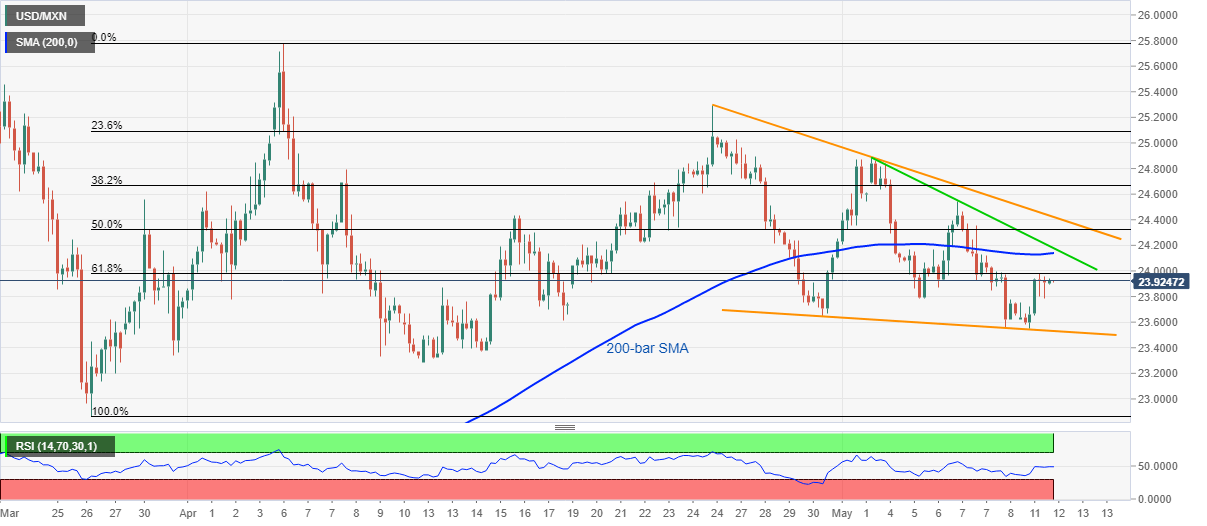
Following its U-turn from 61.8% Fibonacci retracement of March-26 to April 06 upside, USD/MXN trades near 23.93 as Tokyo opens on Tuesday.
Considering the pair’s moves in the last two weeks, a bullish technical pattern, falling wedge, appears on the four-hour (H4) chart.
However, 200-bar SMA and weekly falling trend line, respectively around 24.15 and 24.20, can limit the pair’s recovery moves beyond 61.8% Fibonacci retracement level of 23.98.
Should the bulls manage to confirm the bullish pattern by crossing 24.43 resistance, 25.30 and April month top near 25.80 will be on their radars.
Meanwhile, the formation’s support line, close to 23.53, offers immediate rest during the pair’s further downside while bears’ additional dominance might not refrain from challenging April low of 23.28.
USD/MXN four-hour chart
Trend: Sideways