Back
2 Apr 2020
US Dollar Index Asia Price Forecast: DXY on track to end the New York session above 100.00 level
- US dollar index (DXY) breaks above the 100.00 psychological level.
- The level to beat for buyers is the 100.50 resistance.
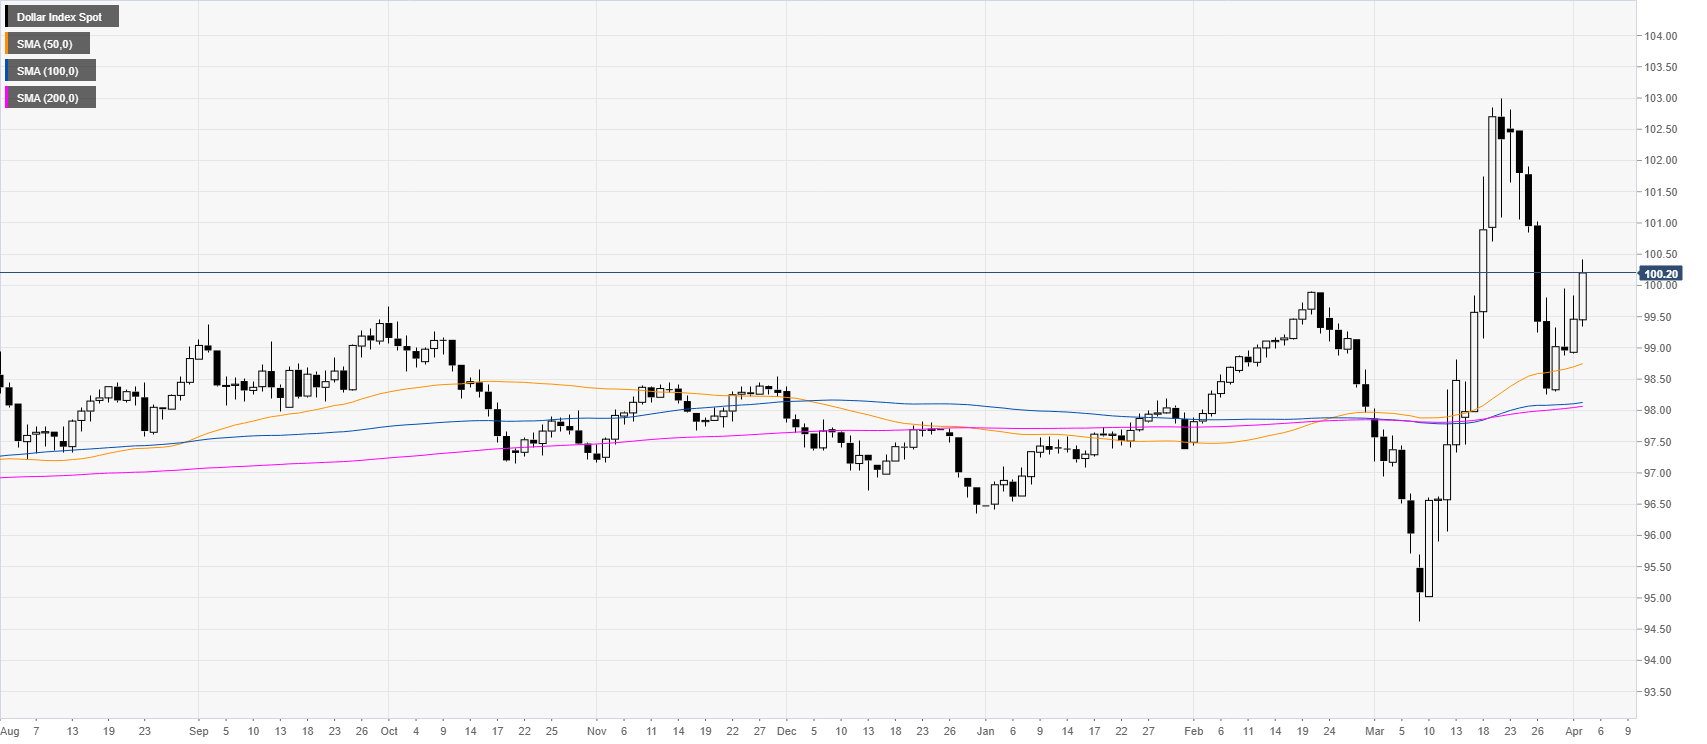
DXY daily chart chart
Last week, DXY had its biggest weekly decline since April 1986 as the buck challenged the 50-day simple moving average on the daily chart and rebonded.
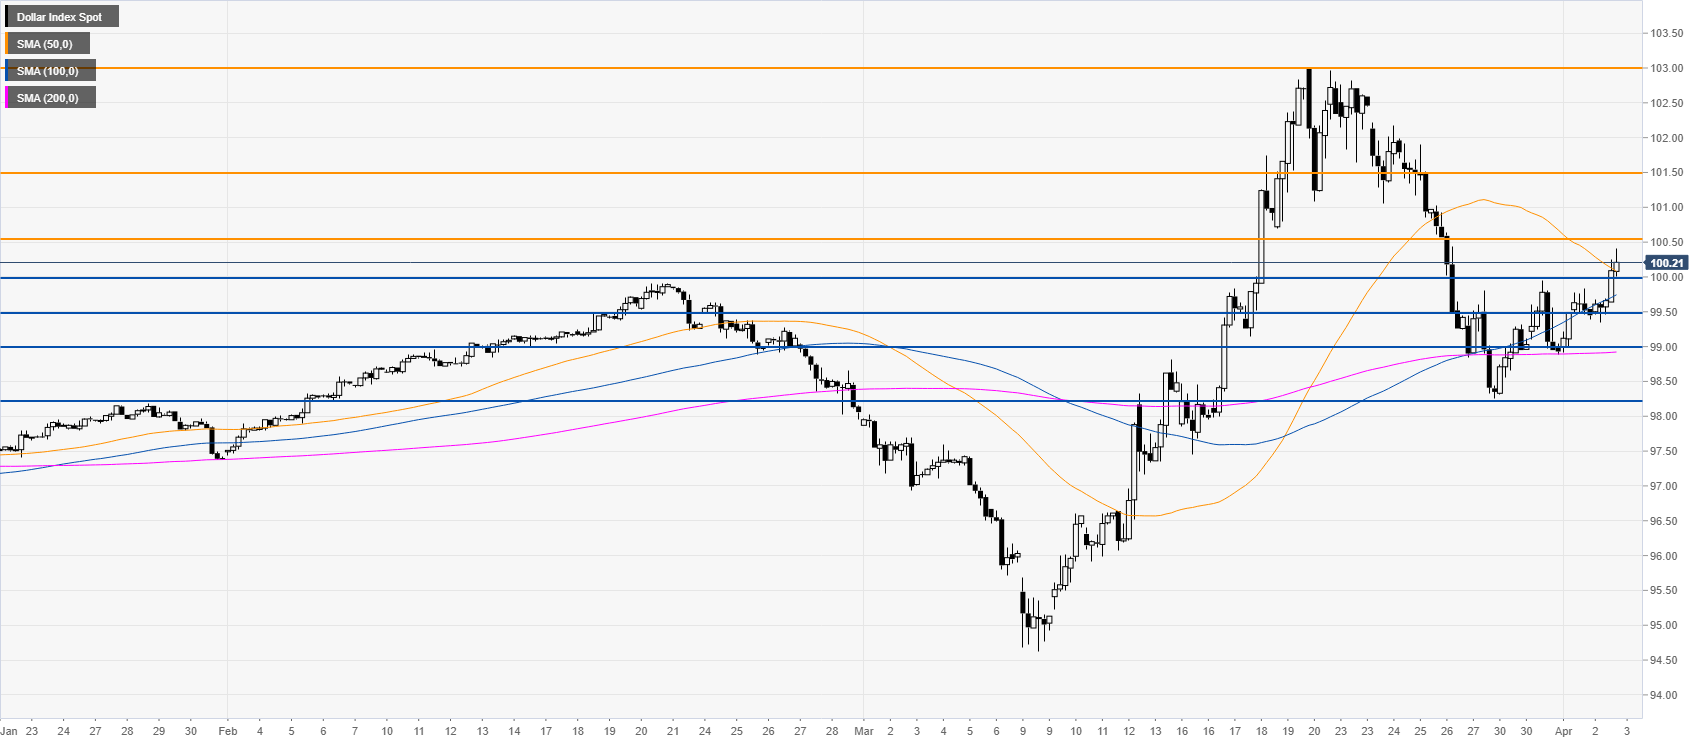
DXY four-hour chart
DXY is gaining steam and is on track to end the New York session above the 100.00 handle and the 100/200 SMAs on the four-hour chart as bulls are looking for a continuation up above the 100.50 resistance en route to the 101.50 level in the medium term. On the flip side, retracement down might find the greenback supported near 100.00, 99.50 and 99.00 levels.
Additional key levels