NZD/USD Price Analysis: Multiple resistances to question recent recovery
- NZD/USD consolidates losses from multi-year lows amid Doji formation on the four-hour chart.
- The early-week lows act as the immediate resistance ahead of the short-term falling trend line.
- Bears will target May 2009 lows during the fresh downside.
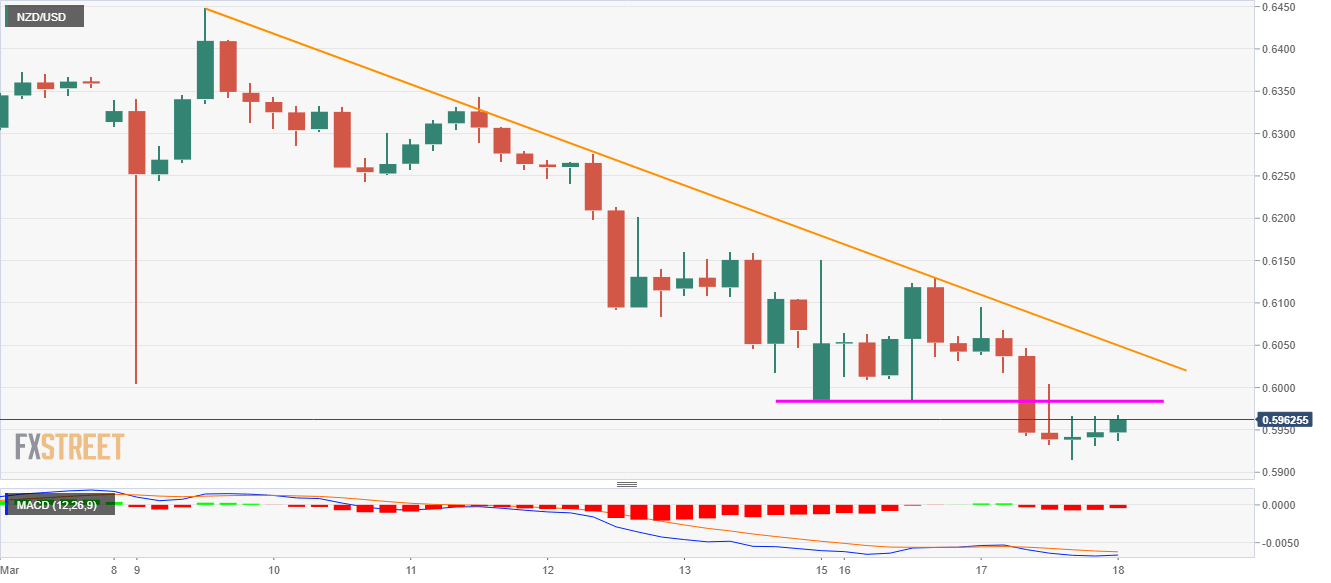
A Doji candlestick formation on the NZD/USD pair’s four-hour (H4) chart favors the quote’s bounce off multi-year low to 0.5965, up 0.54%, during the early Wednesday. Even so, the pair has multiple upside barriers to convince buyers.
Among them, the early-week lows near 0.5985 acts as the closest resistance followed by the descending trend line from March 09, 2020, currently at 0.6050. In between, 0.6000 psychological magnet can act as a buffer.
In a case where the pair manages to stay positive beyond 0.6050, 0.6160 and 0.6200 could lure the bulls.
On the contrary, pair’s declines below the recent low of 0.5915 defy the trend reversal signaling candlestick formation.
As a result, the May 2009 lows surrounding 0.5830 could be the next target for the sellers.
NZD/USD four-hour chart
Trend: Pullback expected