Back
7 Jan 2020
GBP/USD Price Analysis: Pound off daily lows, trades sub-1.3147 resistance
- GBP/USD had a failed breakout above the 1.3200 handle.
- The level to beat for bears is the 1.3100 support.
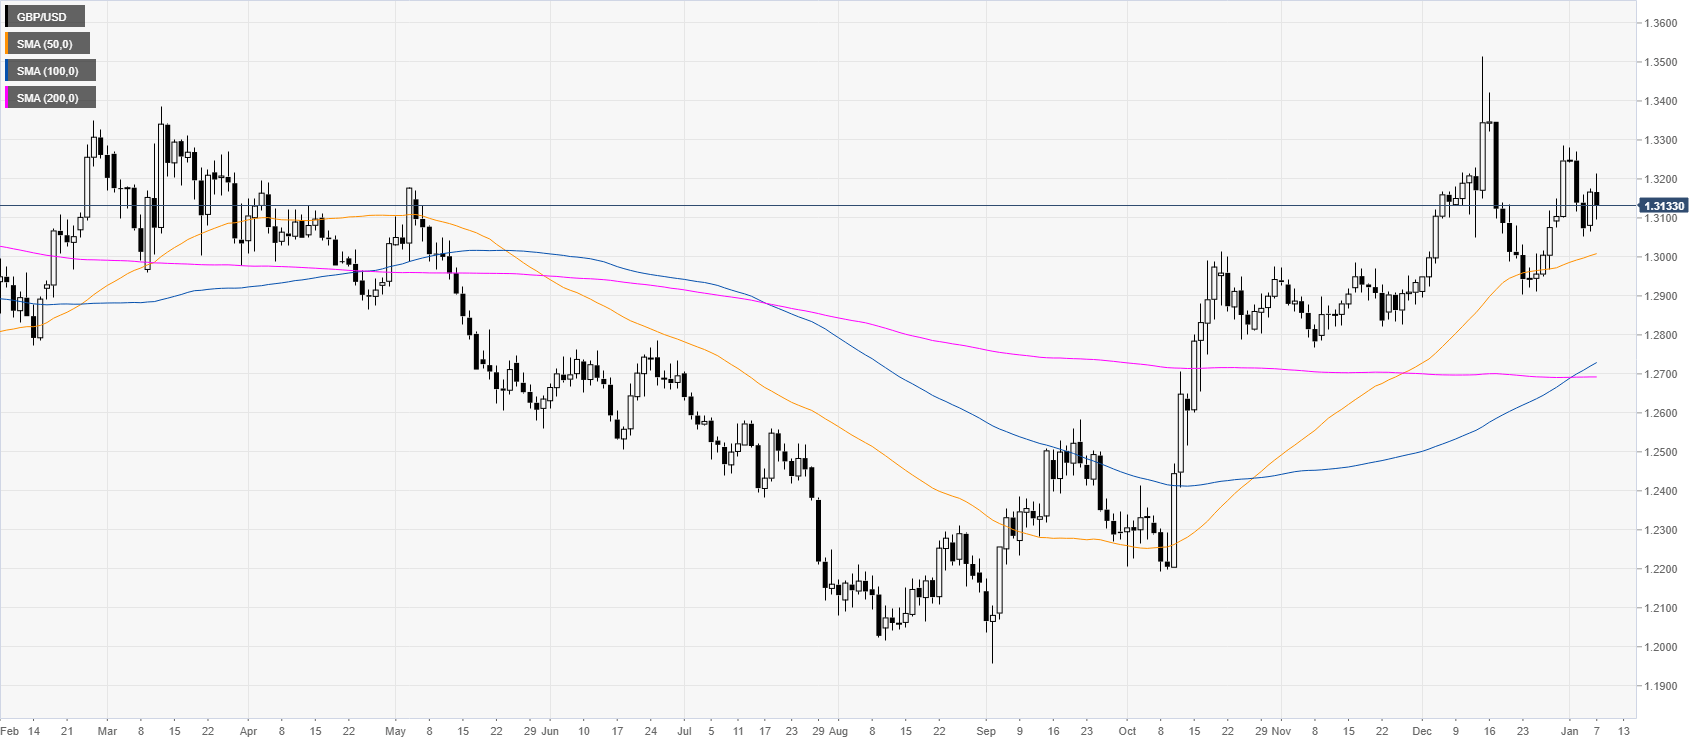
GBP/USD daily chart
GBP/USD is evolving in a bullish channel above the main daily simple moving averages (SMAs). However, 2020 kicked off with a potential lower high just below the 1.3300 handle.
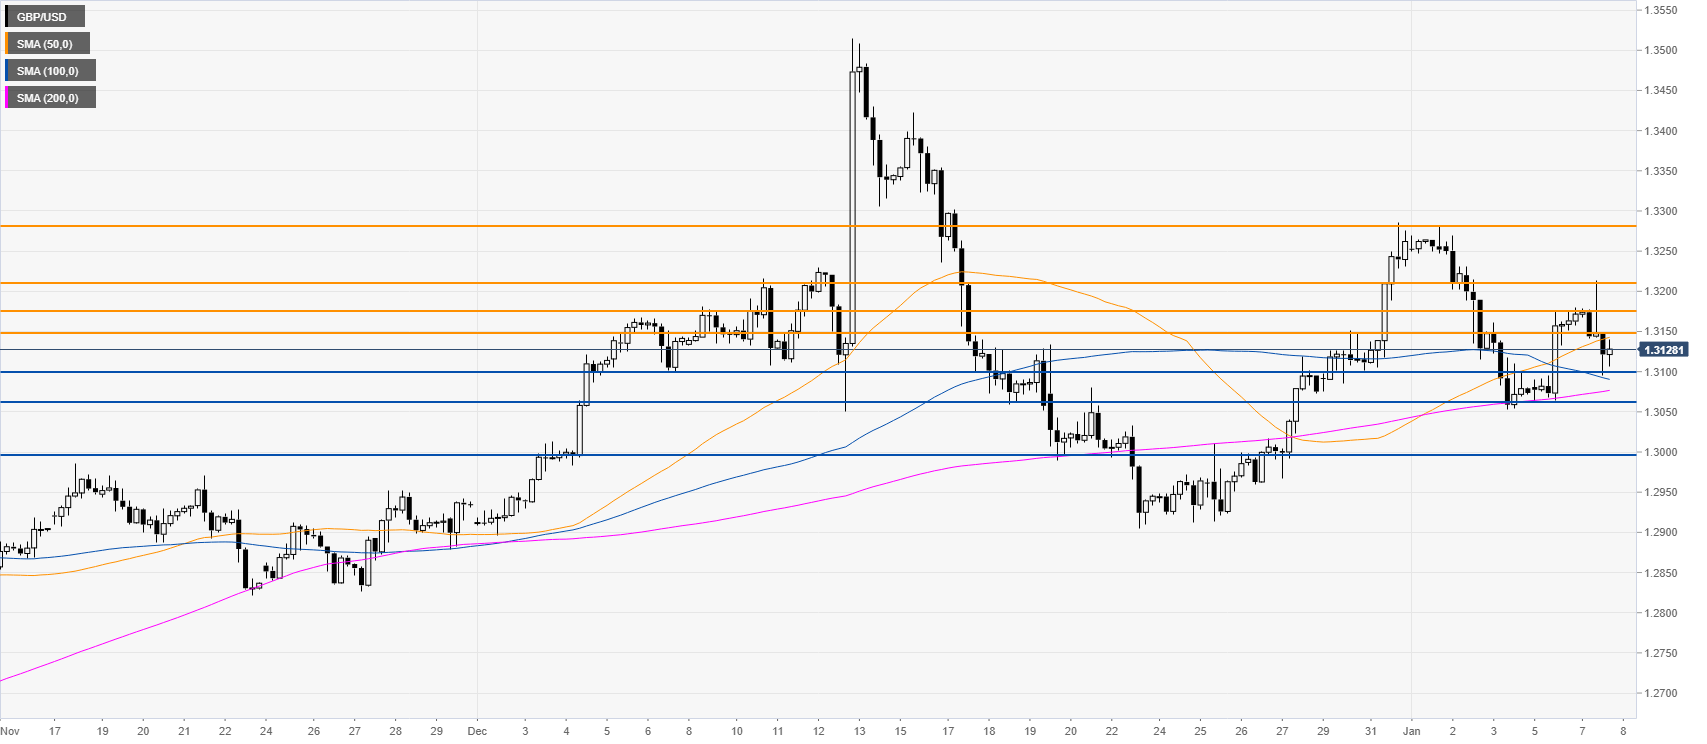
GBP/USD four-hour chart
The cable is starting to show a lack of bullish enthusiasm below the 1.3200 handle and the 50 SMA on the four-hour chart. If the bears attack the 1.3100 handle, the market can decline toward 1.3060 and the 1.2996 level. On the flip side, buyers would need to recapture the 1.3207 resistance to travel towards the 1.3283 level, according to the Technical Confluences Indicator.
Additional key levels