EUR/USD Technical Analysis: Struggles between 50 and 100-DMA amid bullish MACD
- EUR/USD bounces off 50-DMA.
- 100-DMA and 38.2% Fibonacci retracement limit immediate upside.
- Multiple supports around 61.8% Fibonacci retracement will question sellers during fresh declines.
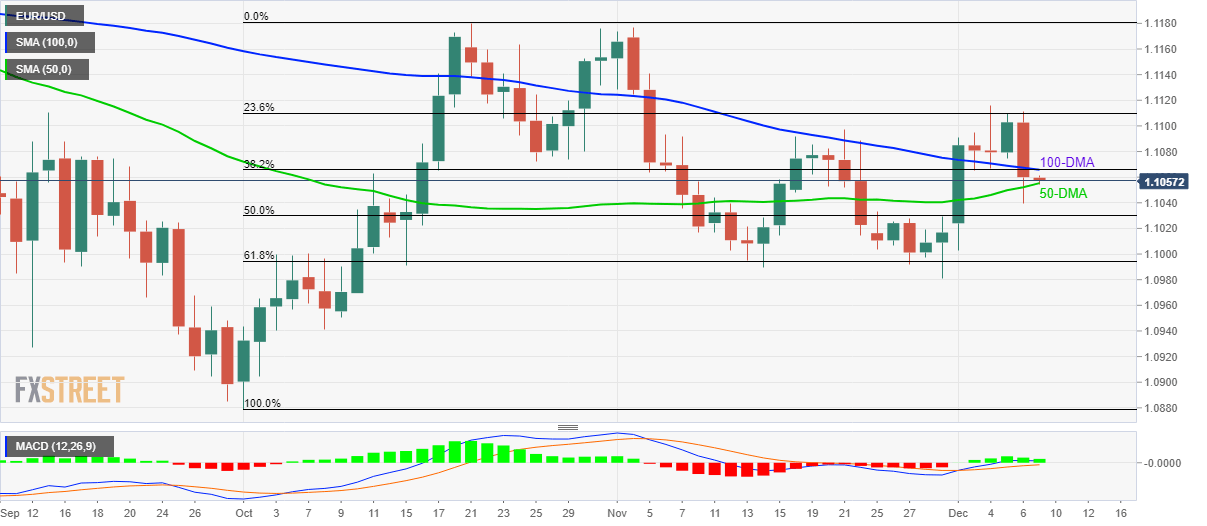
EUR/USD rises to 1.1060 amid the initial trading session on Monday. In doing so, the pair recovers from 50-Day Simple Moving Average (DMA) but stays below a confluence of 100-DMA and 38.2% Fibonacci retracement of October month upside.
Bullish signals from 12-bar Moving Average Convergence and Divergence (MACD) favors the pair’s upside past-1.1065/70 immediate resistance confluence. However, 23.6% Fibonacci retracement around 1.1110 could question Bulls afterward.
In a case where buyers dominate after -1.1110, October month high surrounding 1.1180 will be their favorite.
On the contrary, pair’s declines below the 50-DMA level of 1.1055 can fetch prices to 50% Fibonacci retracement, around 1.1030.
Though, multiple rest-points near 61.8% Fibonacci retracement figure of 1.1000 can challenge bears during additional south-run.
EUR/USD daily chart
Trend: Sideways