Back
29 Oct 2019
USD/JPY technical analysis: Greenback parked below the 109.00 handle and 200-DMA
- USD/JPY is hovering near multi-month highs near the 109.00 handle
- The level to beat for bulls is the 109.11 resistance.
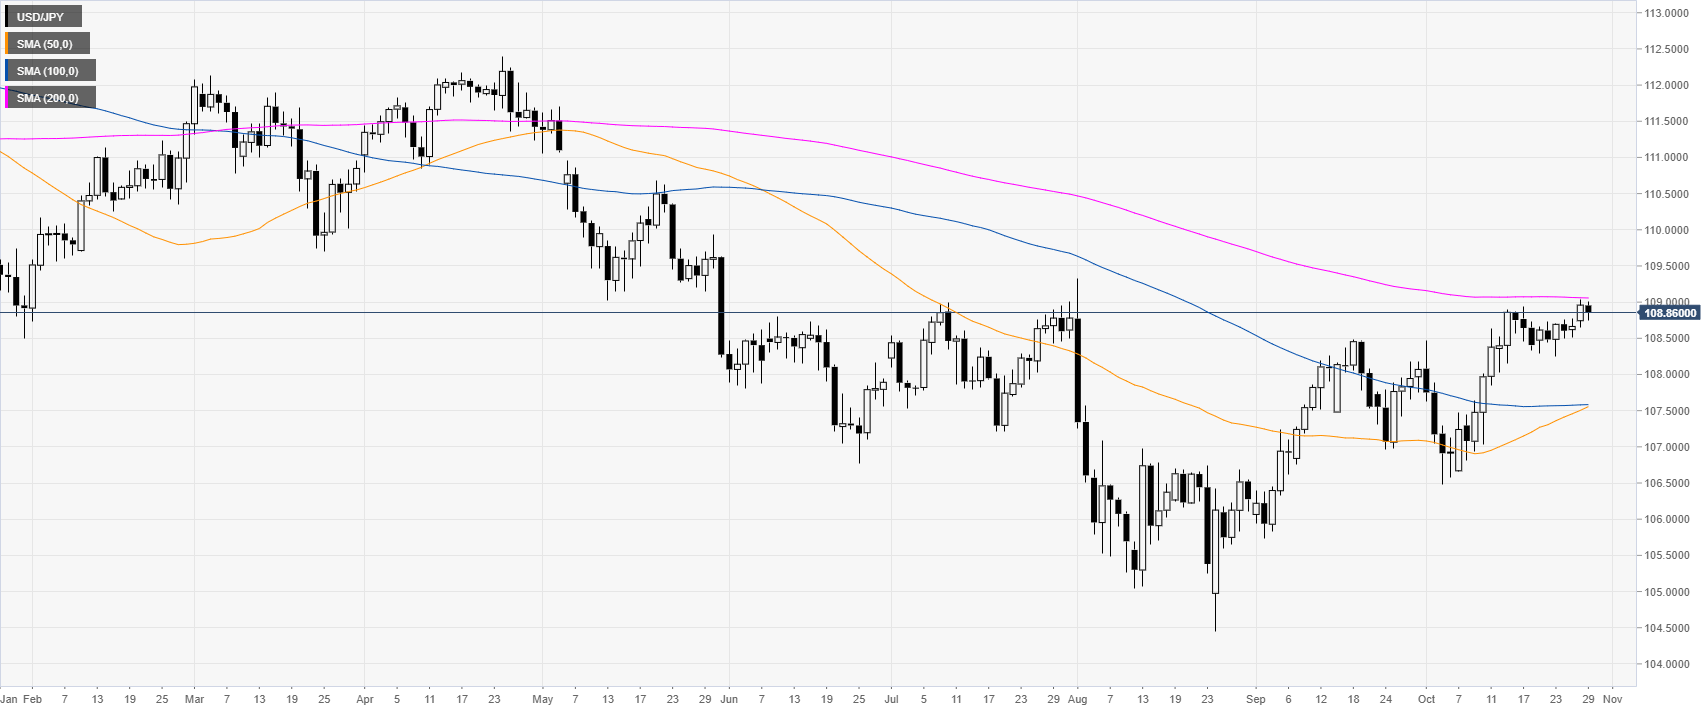
USD/JPY daily chart
USD/JPY is hovering below the 200-day simple moving average (DMA) near the 109.00 level. Since August, the market has been reversing up sharply. However, the market needs to overcome the 109.00 handle to open the doors to more gains.
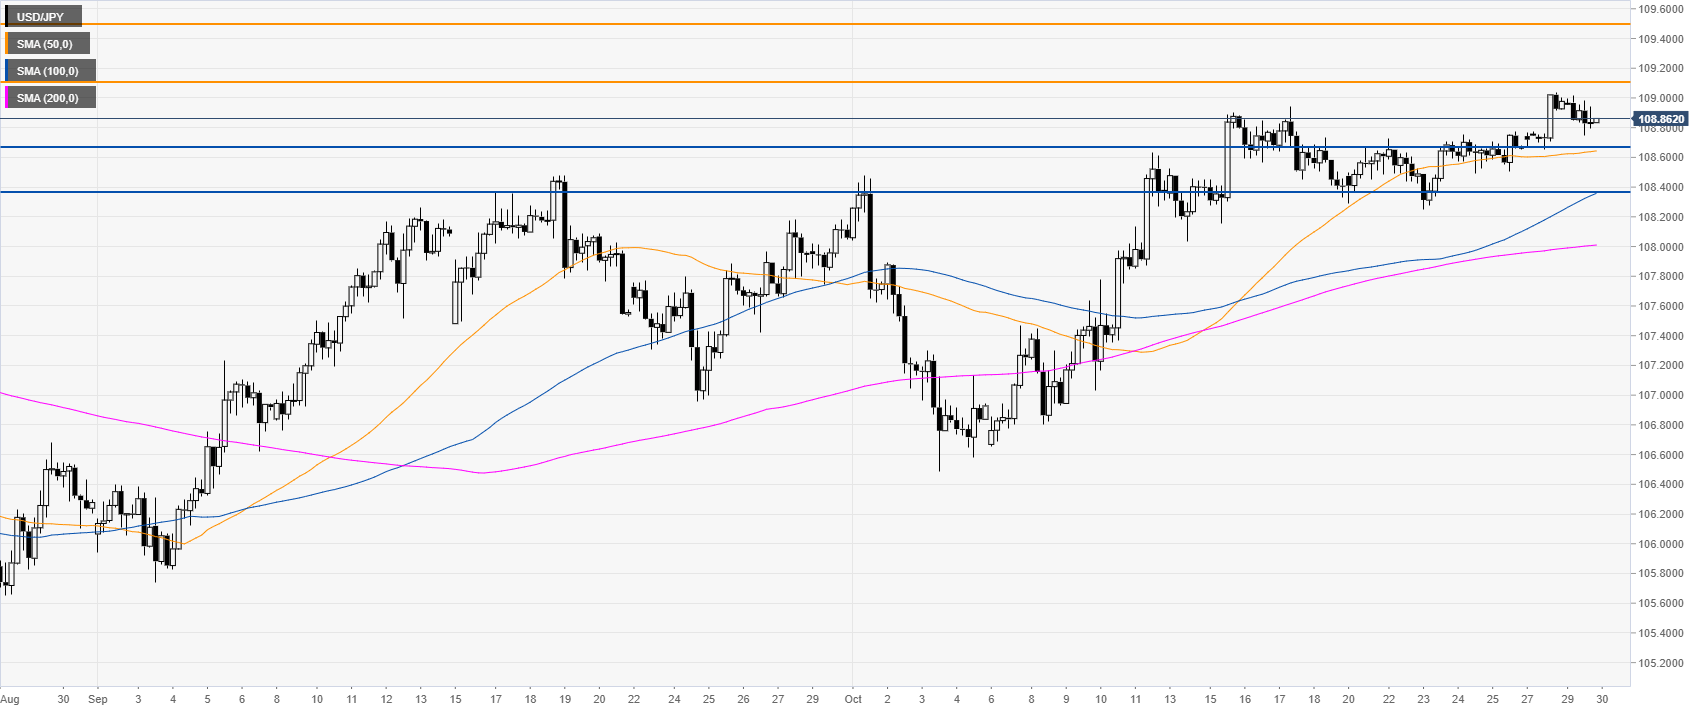
USD/JPY four-hour chart
USD/JPY is trading above the main SMAs on the four-hour chart, suggesting a bullish bias in the medium term. Bulls need to overcome the 109.11 resistance to continue the bull move towards the 109.50 and 110.20 price levels, according to the Technical Confluences Indicator.
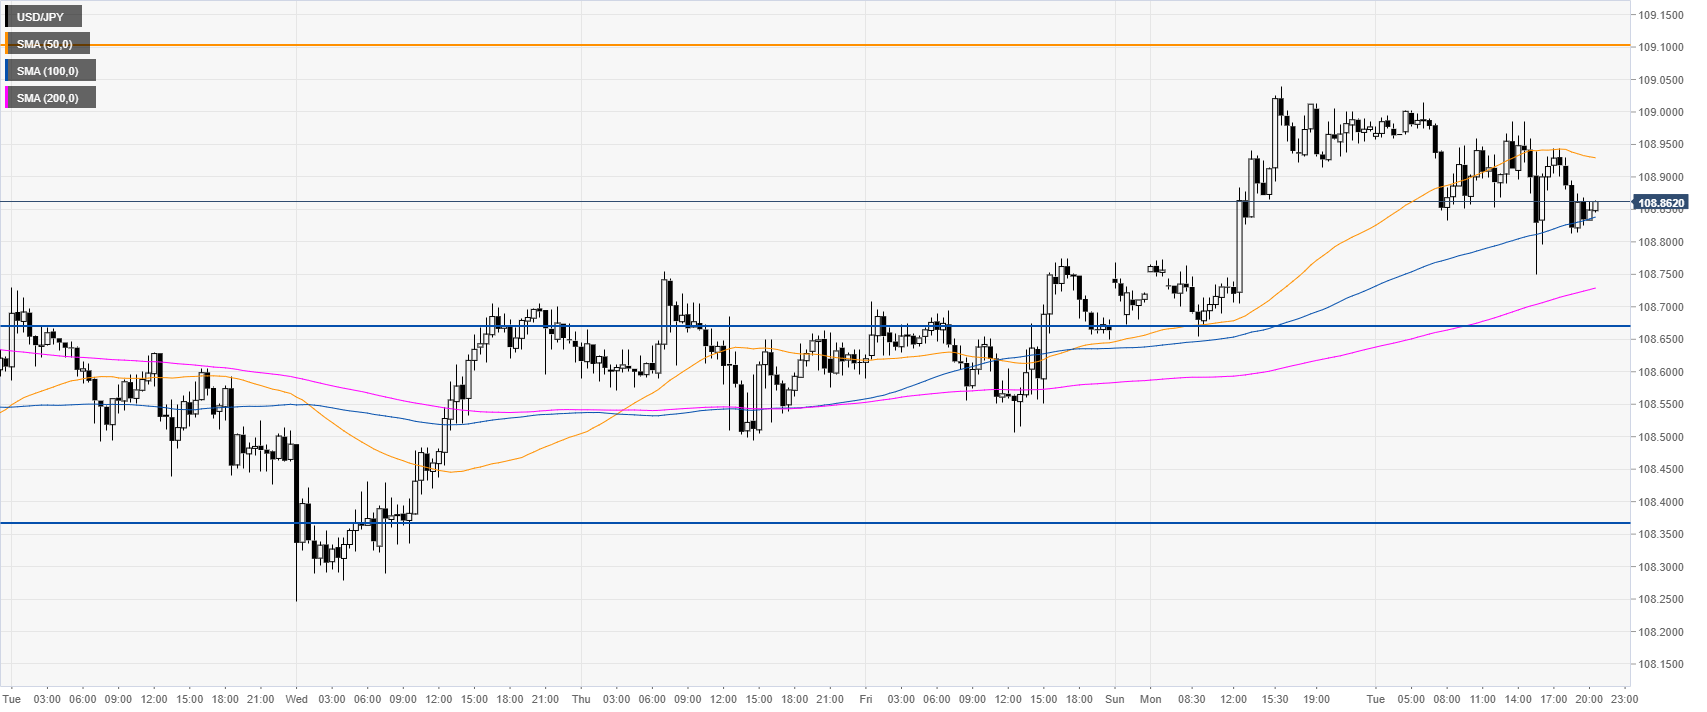
USD/JPY 30-minute chart
USD/JPY is trading above its 100 and 200 SMAs, suggesting a bullish bias in the near term. Support is seen at the 108.67 and 108.36 levels, according to the Technical Confluences Indicator.