Back
9 Oct 2019
Gold technical analysis: Facing 1,510 brick wall ahead of the FOMC Minutes
- Gold is challenging the October highs near 1,510 resistance.
- The FOMC Minutes are scheduled at 18:00 GMT; the news can lead to some volatility.
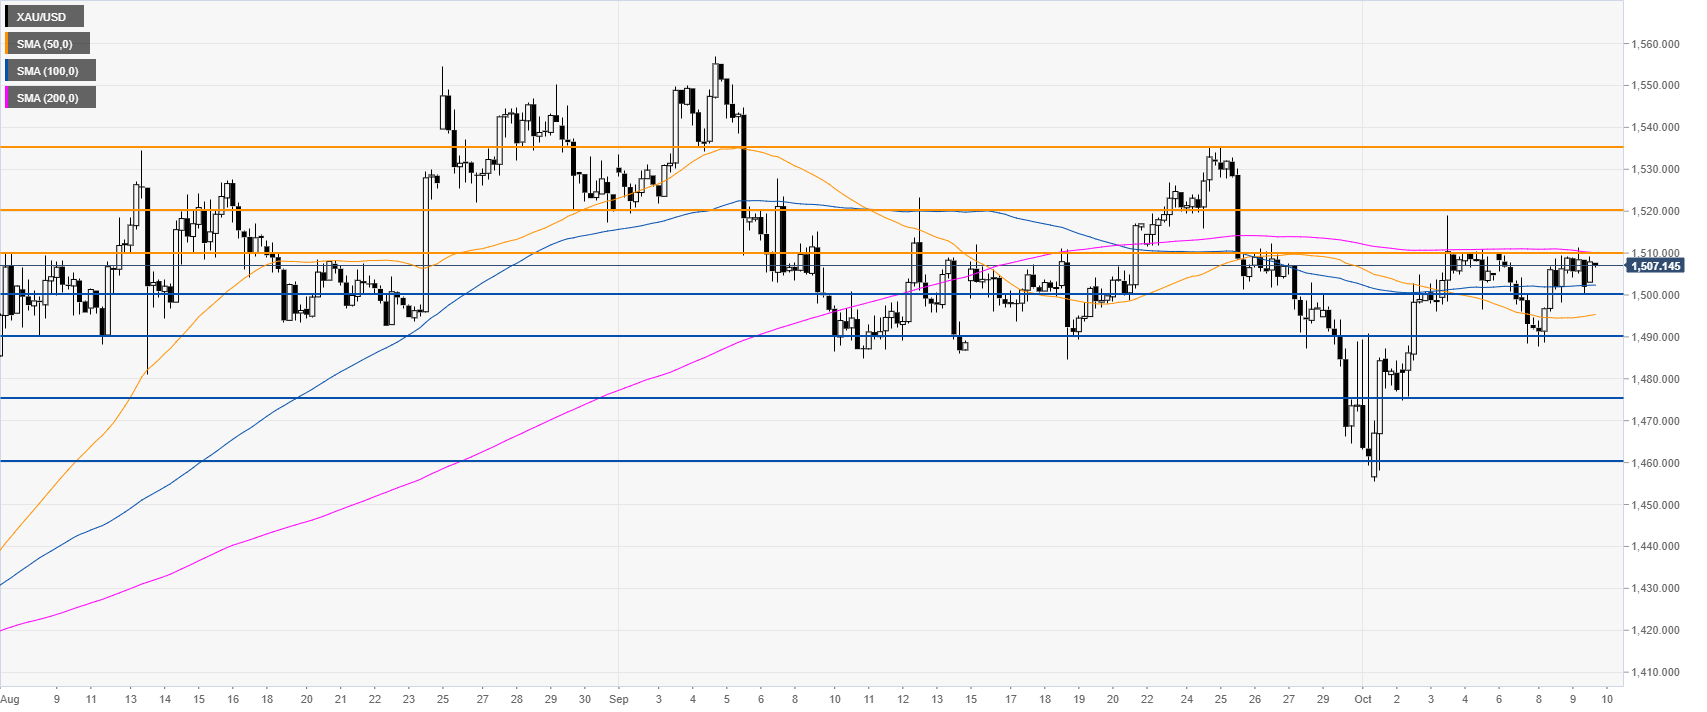
Gold four-hour chart
The yellow metal is trading below the 200-day simple moving average (SMA) and the 1,510 resistance. This level might be a tough nut to crack as it held throughout October. A break below the psychological level of $1,500 a troy once can lead to a decline towards 1,490 swing low. A break below this level can expose the 1,475 and 1,460 support levels if the sellers gather enough steam. On the flip side, a daily close above 1,510 can lead to 1,520 and 1,535 resistances on the way up. The FOMC Minutes are scheduled at 18:00 GMT; the news can lead to some volatility.
Additional key levels