Back
10 Jul 2019
US Dollar Index technical analysis: Fed’s Powell spoils the bull party as DXY flirts with 97.00
- DXY dropped as Fed’s Powell sends a dovish message to the market.
- Immediate resistances are seen at 97.30 and the 97.55 level.
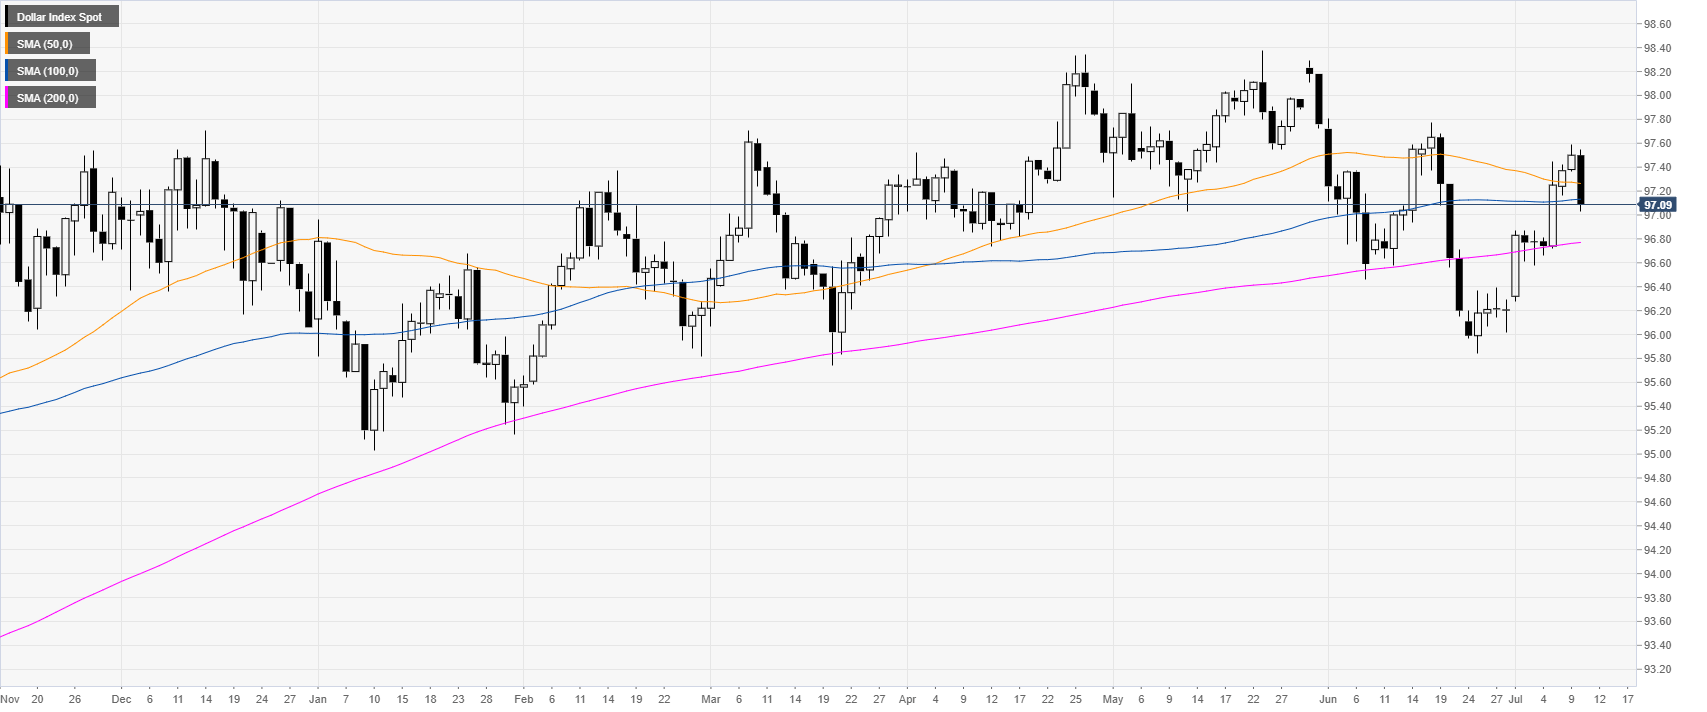
DXY daily chart
The US Dollar Index (DXY) fell below 97.30 and the 50 and 100-day simple moving averages (DSMAs). Dovish remarks by Fed’s Powell sent the greenback down across the board.
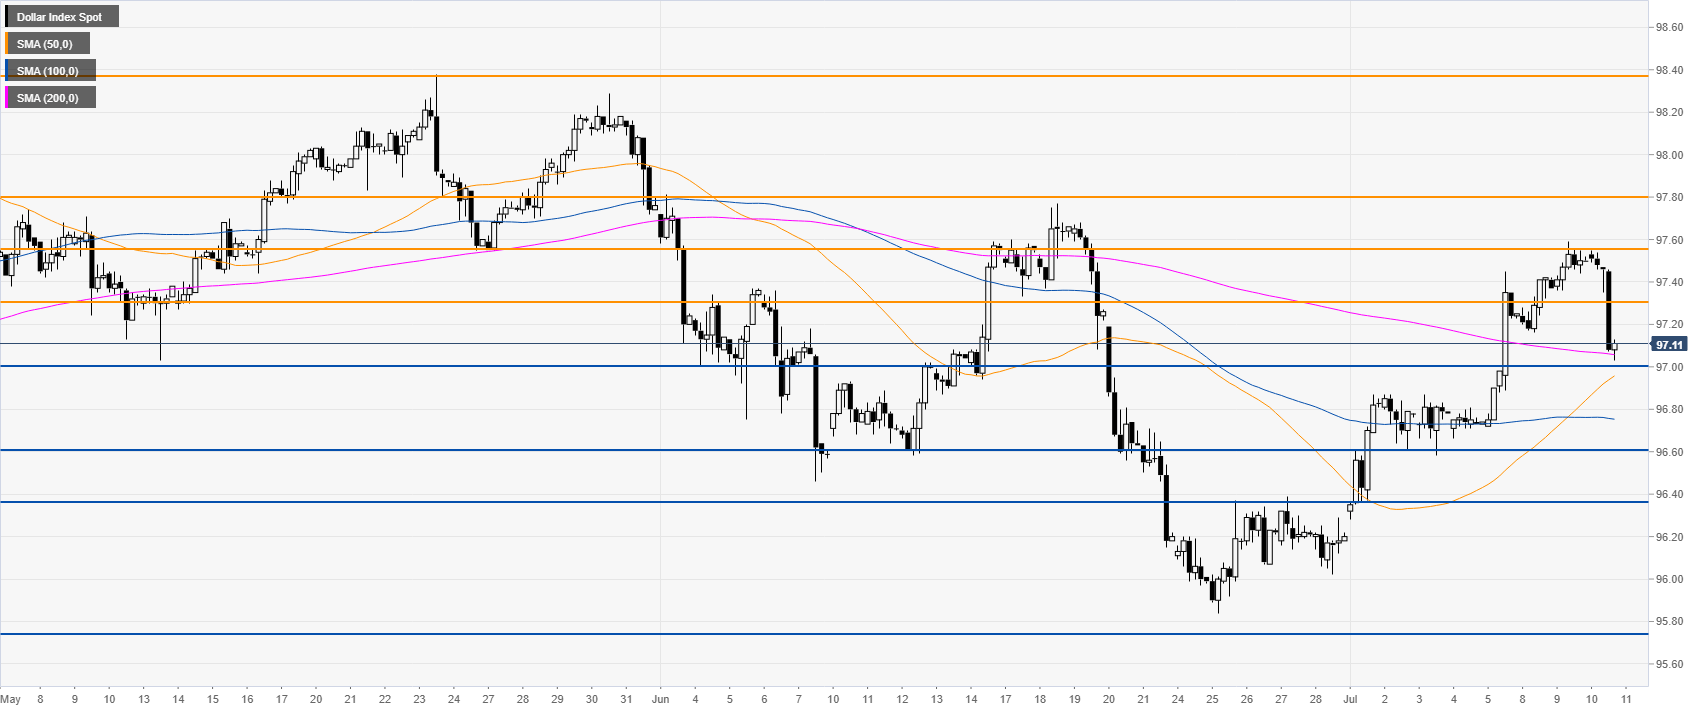
DXY 4-hour chart
The market is challenging the 97.00 handle and the 200 SMA. A breach below 97.00 can lead to 96.60 and 96.37.
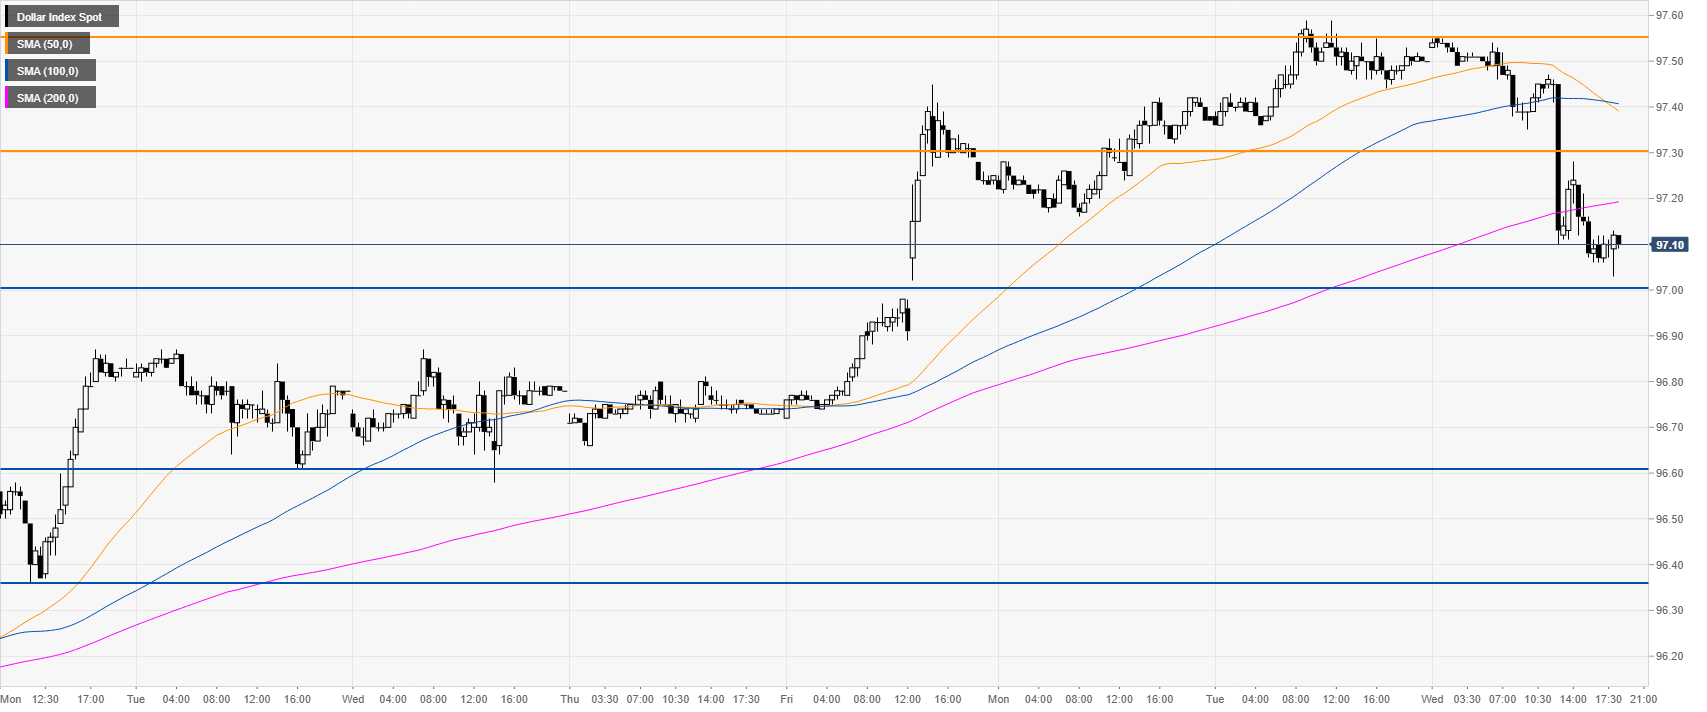
DXY 30-minute chart
The greenback is sliding below 97.30 and the main SMAs suggesting a bearish bias in the near term. The market might enter a consolidation with 97.30 and 97.55 levels as immediate resistances.
Additional key levels