GBP/USD technical analysis: 38.2% Fibo. is the level to beat for buyers, 4H 200MA seems key support
- Overbought RSI on a short timeframe, 38.2% Fibonacci retracement challenge GBP/USD buyers.
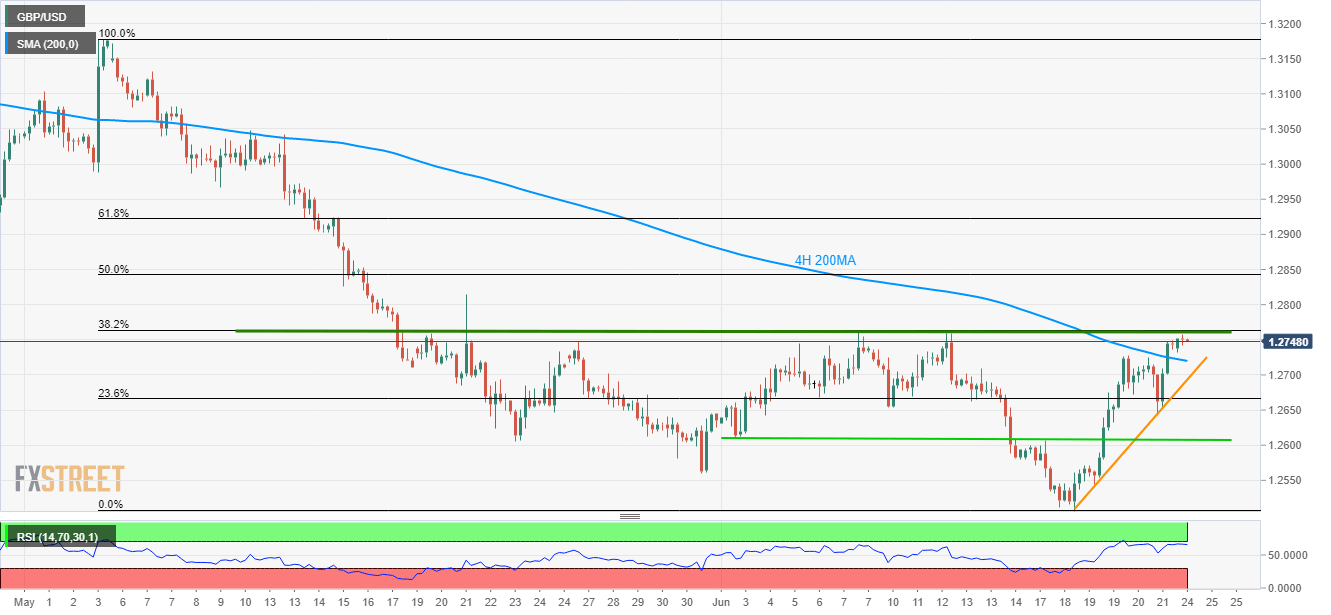
- A successful break of 4H 200MA favors buyers targeting 1.2815.
Although sustained trading beyond 200-hour moving average (4H 200MA) portrays the GBP/USD pair’s strength, the quote is yet to clear 38.2% Fibonacci retracement of its May – June decline as it takes the rounds to 1.2750 while heading into the British market open on Monday.
With the 14-bar relative strength index (RSI) mostly near overbought region, buyers need a strong push to clear the crucial resistance unless chances of witnessing a pullback to 4H 200MA level of 1.2720 can’t be denied.
During the quote’s further declines below 1.2720, 6-day long ascending trend-line at 1.2694 should be watched carefully as the break of which could drag prices toward 1.2610-07 support-zone.
On the flipside, pair sustained a break of the key Fibonacci retracement around 1.2763 level, also comprising the current month high, might not refrain from challenging May 21 high near 1.2815 in order to aim for 50% Fibonacci retracement level of 1.2843 and 1.2900 round-figure resistance during further upside.
GBP/USD 4-Hour chart
Trend: Pullback expected