Back
24 Apr 2019
USD/CAD Technical Analysis: Investors looking at the BoC for directions on the Loonie
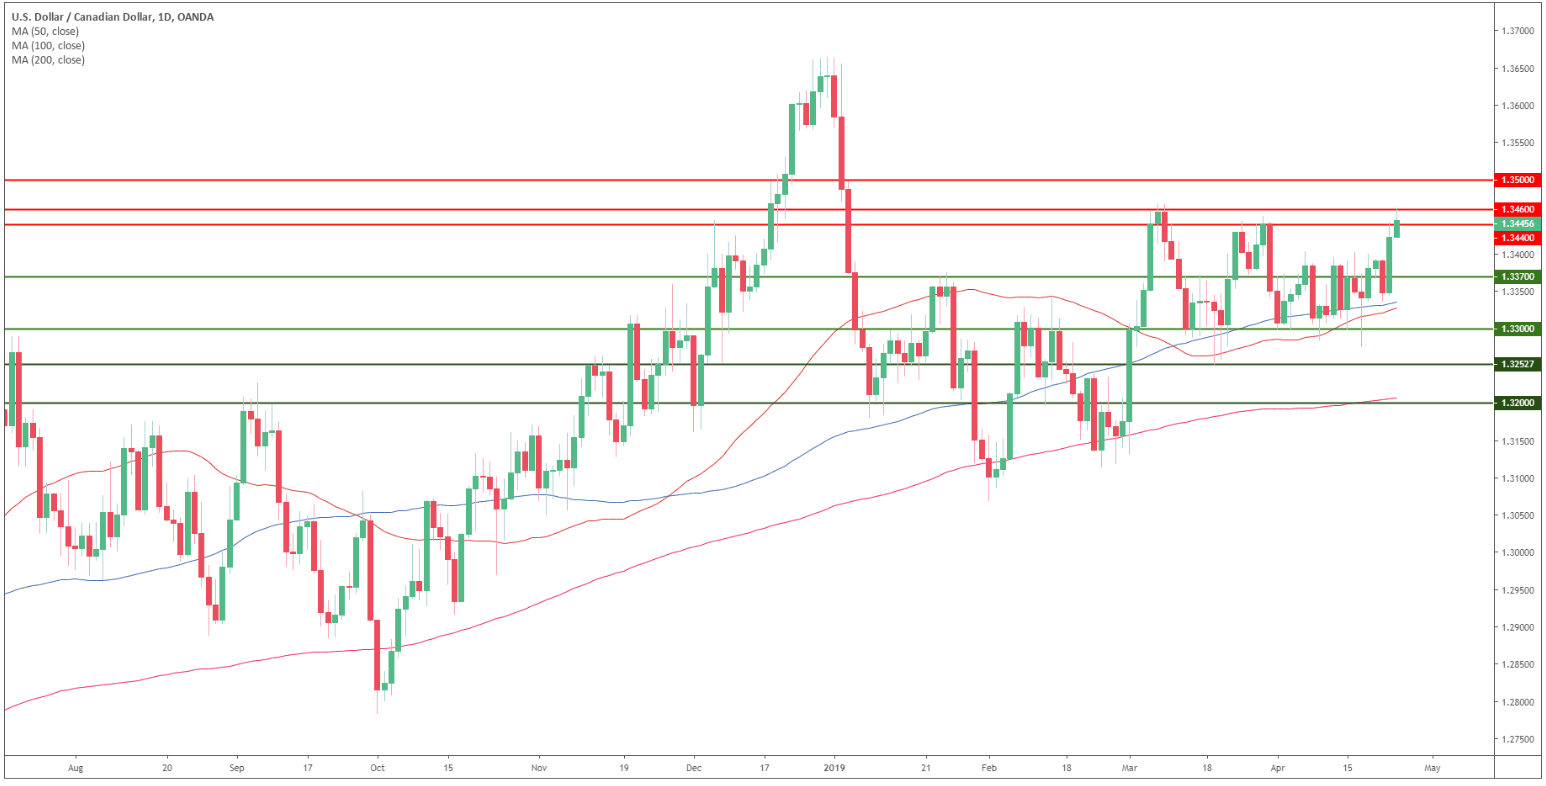
USD/CAD daily chart
- USD/CAD is trading in a bull trend above its 200 simple moving average (SMA) as the market nearing 6.5-week’s highs.
- The Bank of Canada monetary policy decision at 14:00 GMT can lead to high volatility in the currency pair.
USD/CAD 4-hour chart
- USD/CAD reached the 1.3460 resistance. A break above the current resistance would be needed for bulls to move up to 1.3500 the figure and beyond.
- Alternatively, the bearish scenario would see a drop below 1.3440 with a potential revisit of 1.3370 level.
- Additional key levels

Additional key levels