AUD/USD Risk reversals - Corrective forces gathering strength
The AUD/USD pair witnessed a bearish reversal - Thursday Doji and a bearish follow through on Friday on the daily chart. The candle stick pattern says the rally from the low of 0.7572 (July 7 low) may have topped out at 0.7988 levels (Doji candle high)
The decline in the one-month 25 delta risk reversal adds credence to the bearish reversal seen on the daily chart.
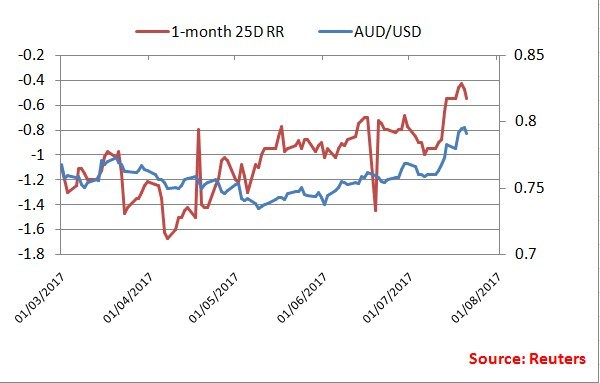
As seen in the chart above, Friday’s decline in the spot was accompanied by a similar drop in the one-month 25 delta risk reversal to -0.55 from the previous day’s figure of -0.475. The drop in the risk reversal indicates increase in demand for the downside bets - Put options.
What’s next for the Aussie?
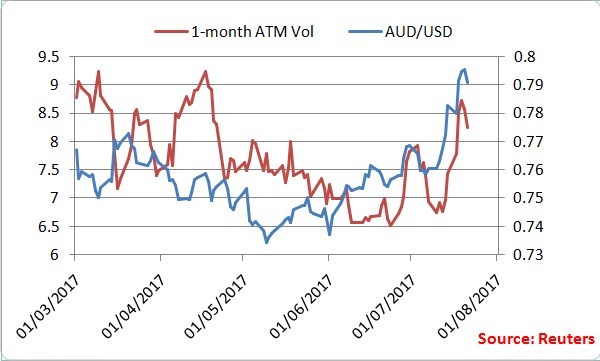
The gains seen in Asia could be short lived as suggested by bearish technicals and falling risk reversal. The spot could test the 10-DMA support level of 0.7833. The move is likely to be dull as suggested by the decline in the one-month ATM option volatility