NZD/USD Price Analysis: Pair soared and approaches 20-day SMA
- NZD/USD soared 1.02% to trade near 0.5895.
- The pair approached the 20-day SMA at around 0.5910, seemingly continuing its recovery.
The NZD/USD rose by 1.02% to trade near 0.5895 in Wednesday's session, continuing its recovery and approaching the 20-day Simple Moving Average (SMA) at around 0.5910. The Relative Strength Index (RSI) indicates that buying pressure is recovering, while the Moving Average Convergence Divergence (MACD) shows that selling pressure is flat, which prints signs of a recovering buying momentum.
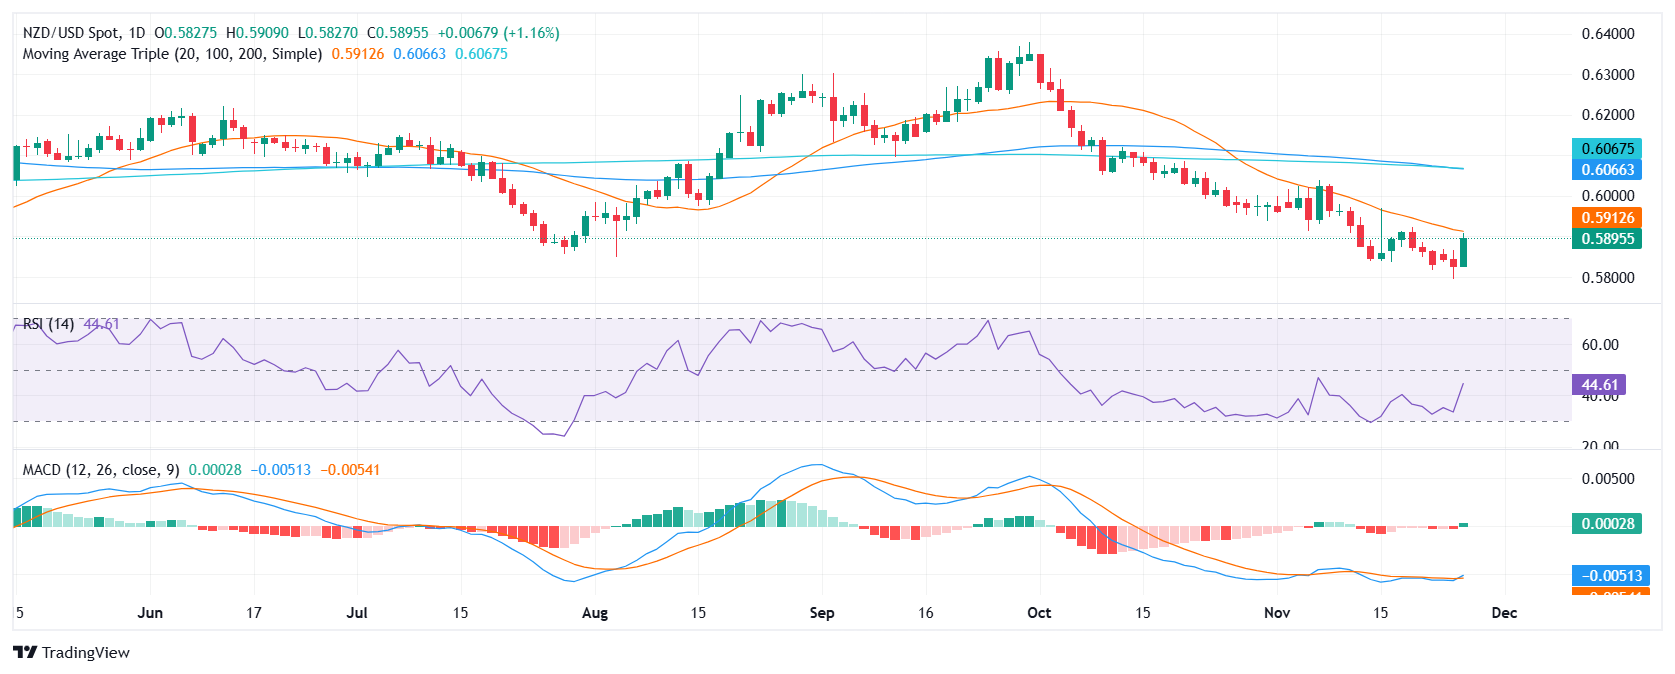
Should the pair breach the 20-day SMA, the outlook may improve further potentially targeting the 0.6000 area. On the downside, bears might invalidate the recovery if they regain the 0.5800 area and push the pair back below yearly lows. In addition, traders shouldn’t take their eyes of the looming bearish crossover between the 100 and 200-day SMA at around 0.6070 area which could give arguments to the bearish rhetoric.
NZD/USD daily chart