USD/INR Price Analysis: Consolidates around 82.00, bears have the upper hand below 200-DMA
- USD/INR extends its sideways consolidative price move in a two-week-old trading range.
- Acceptance below the 200-day SMA supports prospects for a further depreciating move.
- A sustained move above the trading range hurdle is needed to negate the negative bias.
The USD/INR pair continues with its struggle to gain any meaningful traction and remains confined in a familiar trading band held over the past two weeks or so. Spot prices hold steady above the 82.00 mark through the Asian session on Thursday, though the technical setup seems tilted in favour of bearish traders.
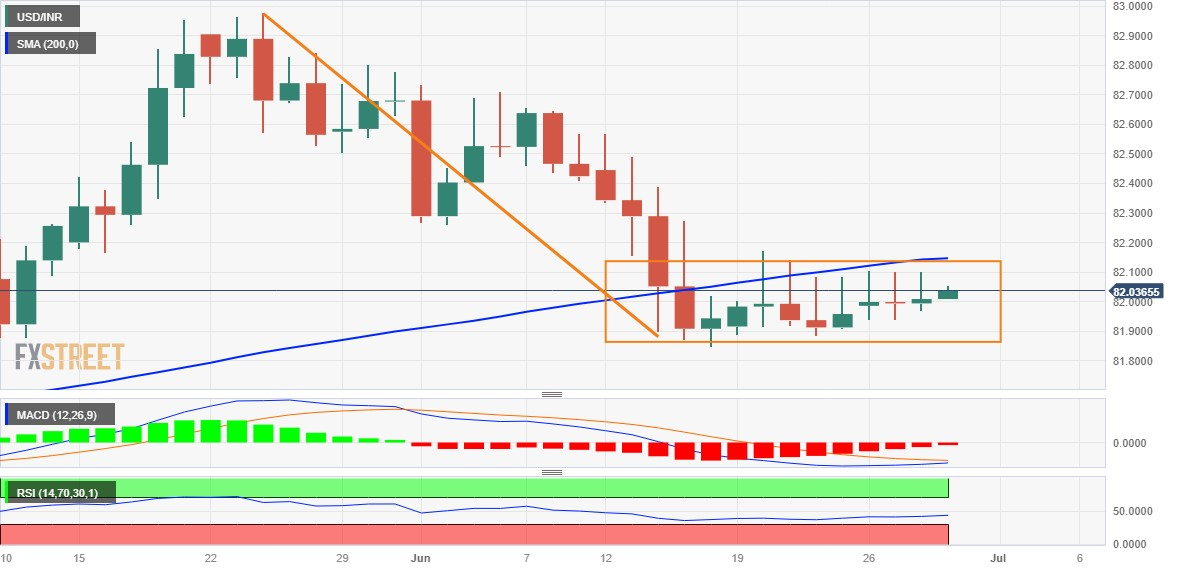
The subdued/range-bound price move constitutes the formation of a rectangle on the daily chart. Against the backdrop of the recent pullback from the vicinity of the 83.00 mark, this might still be categorized as a bearish consolidation phase. Moreover, acceptance below the very important 200-day Simple Moving Average (SMA), for the first time since January 2022, suggests that the path of least resistance for the USD/INR pair is to the downside.
The negative outlook is reinforced by the fact that technical indicators on the daily chart are holding in the bearish territory and are still far from being in the oversold zone. That said, it will still be prudent to wait for a sustained break below the trading range support, around the 81.85 area, before positioning for any further downfall. The USD/INR pair might then slide to the 81.50 intermediate support before dropping to sub-81.00 levels or the YTD low.
On the flip side, the trading range resistance, around the 82.15 region, which coincides with the 200-day SMA, might continue to act as an immediate strong barrier. A sustained strength beyond could negate the negative outlook and trigger some near-term short-covering rally. The momentum could then lift the USD/INR pair back towards the 82.70-82.75 intermediate hurdle, above which bulls are likely to make a fresh attempt to conquer the 83.00 mark.
USD/INR daily chart
Key levels to watch