GBP/JPY Price Analysis: Bulls to face 168.00, a price that capped previous rallies
- The GBP/JPY is upward biased after testing the 20-day EMA during the week, though it struggles at around 168.00.
- Oscillators showed mixed readings, though the RSI indicator aiming to 50 suggests a pullback in the near term.
The GBP/JPY snaps two days of gains and retreats modestly towards the 167.00 figure as the early stages of the Asian session are witnessed. The GBP/JPY exchange hands at around 167.16, diving 0.16%.
GBP/JPY Price Action
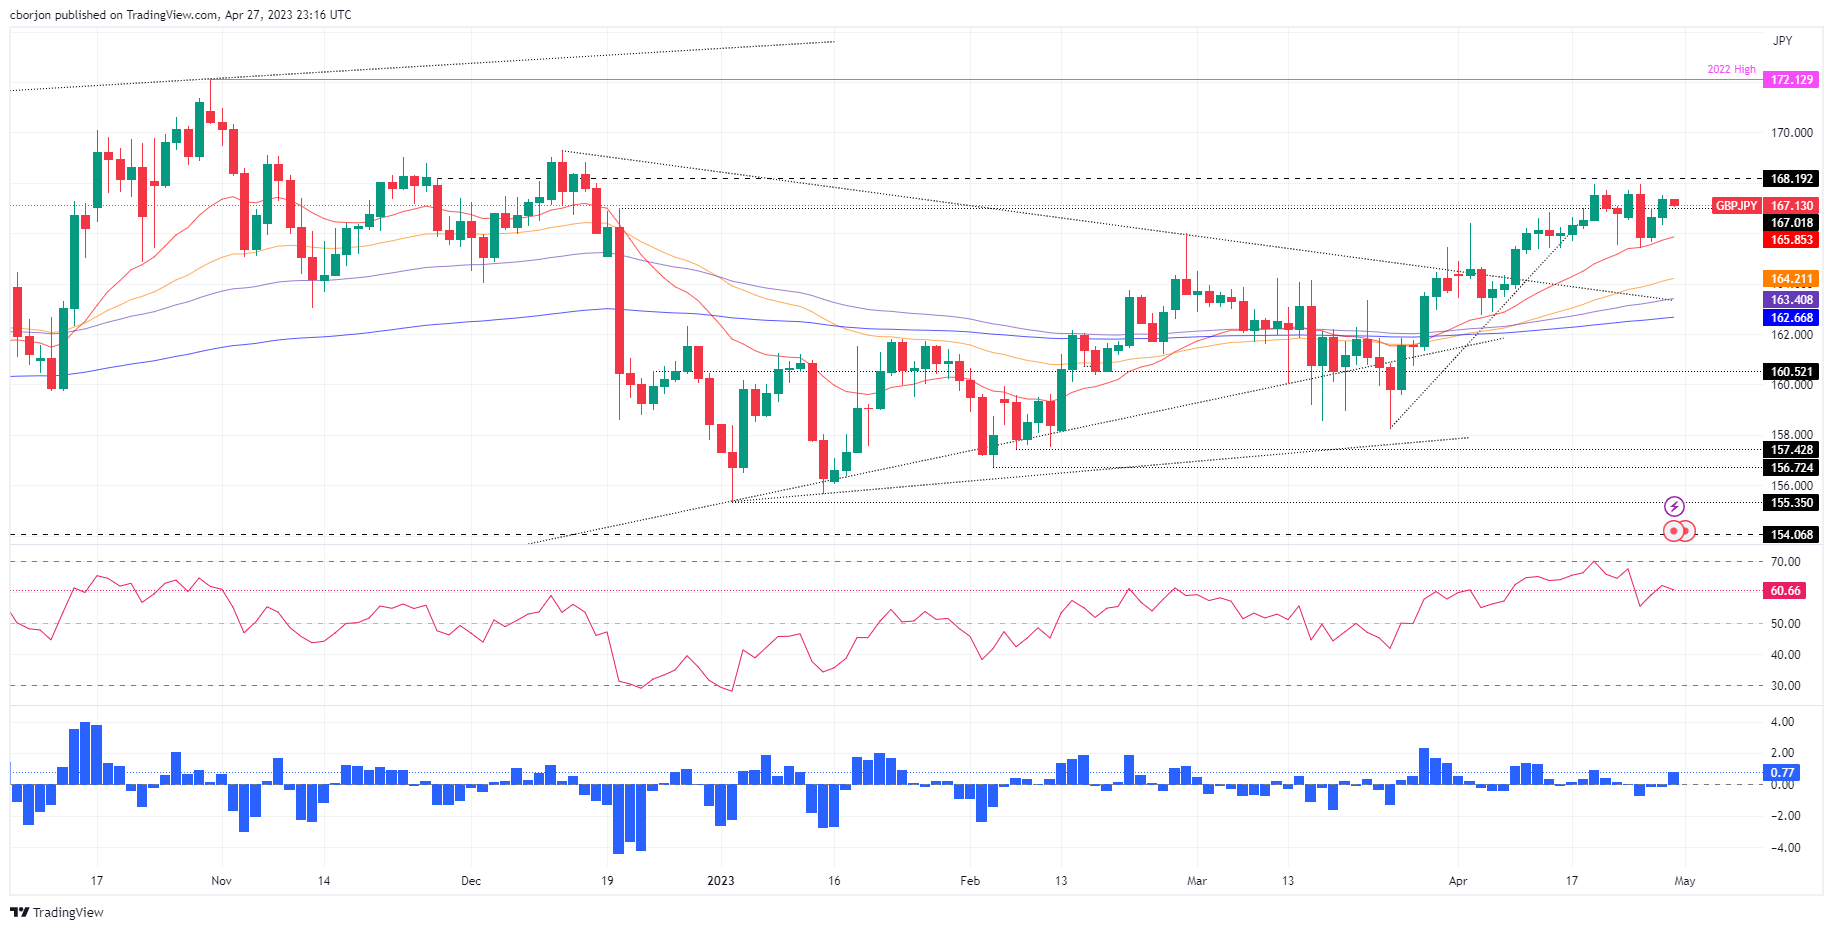
The daily graphic shows that the GBP/JPY remains upward biased, though it encountered a wall of resistance at around the 168.00 mark. Although it has printed back-to-back days of gains, failure to extend its rally past 168.00 keep downside risks looming. In addition, the Relative Strength Index (RSI) indicator continued to aim lower, suggesting that sellers are still hovering.
Meanwhile, the Rate of Change (RoC) shows buyers remain present, though a possible rally remains in play. If GBP/JPY buyers reclaim 168.00, that could exacerbate an upward move to December 13 swing high at 169.27. But first, there are some hurdles on the way north.
Firstly, the YTD is high at 167.97, nearby the 168.00 figure. A breach of the latter will expose the last December cycle high at 169.27.
Conversely, if GBP/JPY falls below 167.00, that would exacerbate a fall initially to the 20-day EMA at 165.85, followed by the latest week low of 165.42, before testing the 50-day EMA at 164.21.
GBP/JPY Daily Chart